
|
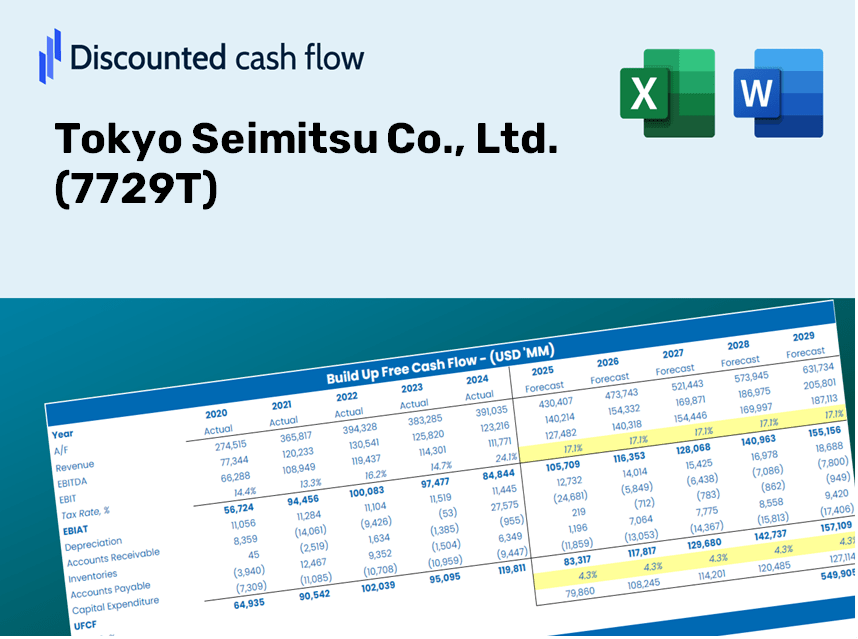
Tokyo Seimitsu Co., Ltd. (7729.t) DCF -Bewertung |
Fully Editable: Tailor To Your Needs In Excel Or Sheets
Professional Design: Trusted, Industry-Standard Templates
Investor-Approved Valuation Models
MAC/PC Compatible, Fully Unlocked
No Expertise Is Needed; Easy To Follow
Tokyo Seimitsu Co., Ltd. (7729.T) Bundle
Gewinnen Sie Einblicke in Ihre Tokyo Seimitsu Co., Ltd. (7729t) Bewertungsanalyse mit unserem DCF-Taschenrechner des hochmodernen DCF! Diese Excel -Vorlage mit tatsächlichen (7729T) Daten vorinstalliert und ermöglicht es Ihnen, die Prognosen und Annahmen anzupassen, um den inneren Wert von Tokyo Seimitsu Co., Ltd., genau zu bestimmen.
Discounted Cash Flow (DCF) - (USD MM)
| Year | AY1 2020 |
AY2 2021 |
AY3 2022 |
AY4 2023 |
AY5 2024 |
FY1 2025 |
FY2 2026 |
FY3 2027 |
FY4 2028 |
FY5 2029 |
|---|---|---|---|---|---|---|---|---|---|---|
| Revenue | 97,105.0 | 130,702.0 | 146,801.0 | 134,680.0 | 150,534.0 | 169,512.9 | 190,884.6 | 214,950.7 | 242,051.1 | 272,568.2 |
| Revenue Growth, % | 0 | 34.6 | 12.32 | -8.26 | 11.77 | 12.61 | 12.61 | 12.61 | 12.61 | 12.61 |
| EBITDA | 19,763.0 | 33,144.0 | 37,215.0 | 30,036.0 | 39,630.0 | 40,577.8 | 45,693.7 | 51,454.6 | 57,941.9 | 65,247.0 |
| EBITDA, % | 20.35 | 25.36 | 25.35 | 22.3 | 26.33 | 23.94 | 23.94 | 23.94 | 23.94 | 23.94 |
| Depreciation | 3,544.0 | 3,580.0 | 3,874.0 | 4,727.0 | 5,154.0 | 5,411.3 | 6,093.5 | 6,861.8 | 7,726.9 | 8,701.1 |
| Depreciation, % | 3.65 | 2.74 | 2.64 | 3.51 | 3.42 | 3.19 | 3.19 | 3.19 | 3.19 | 3.19 |
| EBIT | 16,219.0 | 29,564.0 | 33,341.0 | 25,309.0 | 34,476.0 | 35,166.5 | 39,600.2 | 44,592.8 | 50,215.0 | 56,545.9 |
| EBIT, % | 16.7 | 22.62 | 22.71 | 18.79 | 22.9 | 20.75 | 20.75 | 20.75 | 20.75 | 20.75 |
| Total Cash | 43,657.0 | 49,033.0 | 40,080.0 | 36,782.0 | 54,541.0 | 58,759.4 | 66,167.6 | 74,509.8 | 83,903.7 | 94,482.1 |
| Total Cash, percent | .0 | .0 | .0 | .0 | .0 | .0 | .0 | .0 | .0 | .0 |
| Account Receivables | 30,896.0 | 38,326.0 | 43,346.0 | 42,767.0 | 39,763.0 | 50,459.4 | 56,821.2 | 63,985.0 | 72,052.1 | 81,136.2 |
| Account Receivables, % | 31.82 | 29.32 | 29.53 | 31.75 | 26.41 | 29.77 | 29.77 | 29.77 | 29.77 | 29.77 |
| Inventories | 32,885.0 | 40,281.0 | 53,480.0 | 67,224.0 | 69,512.0 | 66,857.7 | 75,287.0 | 84,778.9 | 95,467.6 | 107,503.8 |
| Inventories, % | 33.87 | 30.82 | 36.43 | 49.91 | 46.18 | 39.44 | 39.44 | 39.44 | 39.44 | 39.44 |
| Accounts Payable | 23,061.0 | 29,875.0 | 22,358.0 | 8,517.0 | 16,665.0 | 26,861.2 | 30,247.7 | 34,061.3 | 38,355.6 | 43,191.4 |
| Accounts Payable, % | 23.75 | 22.86 | 15.23 | 6.32 | 11.07 | 15.85 | 15.85 | 15.85 | 15.85 | 15.85 |
| Capital Expenditure | -6,052.0 | -9,727.0 | -9,064.0 | -10,852.0 | -9,574.0 | -11,617.2 | -13,081.9 | -14,731.2 | -16,588.5 | -18,679.9 |
| Capital Expenditure, % | -6.23 | -7.44 | -6.17 | -8.06 | -6.36 | -6.85 | -6.85 | -6.85 | -6.85 | -6.85 |
| Tax Rate, % | 25.2 | 25.2 | 25.2 | 25.2 | 25.2 | 25.2 | 25.2 | 25.2 | 25.2 | 25.2 |
| EBITAT | 12,229.3 | 21,360.7 | 23,658.4 | 17,994.4 | 25,788.3 | 25,637.2 | 28,869.5 | 32,509.2 | 36,607.9 | 41,223.3 |
| Depreciation | ||||||||||
| Changes in Account Receivables | ||||||||||
| Changes in Inventories | ||||||||||
| Changes in Accounts Payable | ||||||||||
| Capital Expenditure | ||||||||||
| UFCF | -30,998.7 | 7,201.7 | -7,267.6 | -15,136.6 | 30,232.3 | 21,585.3 | 10,476.7 | 11,797.5 | 13,284.9 | 14,959.8 |
| WACC, % | 7.11 | 7.11 | 7.1 | 7.1 | 7.11 | 7.11 | 7.11 | 7.11 | 7.11 | 7.11 |
| PV UFCF | ||||||||||
| SUM PV UFCF | 59,594.7 | |||||||||
| Long Term Growth Rate, % | 2.00 | |||||||||
| Free cash flow (T + 1) | 15,259 | |||||||||
| Terminal Value | 298,795 | |||||||||
| Present Terminal Value | 211,976 | |||||||||
| Enterprise Value | 271,570 | |||||||||
| Net Debt | -34,458 | |||||||||
| Equity Value | 306,028 | |||||||||
| Diluted Shares Outstanding, MM | 41 | |||||||||
| Equity Value Per Share | 7,499.96 |
Benefits You Will Receive
- Pre-Loaded Financial Model: Tokyo Seimitsu's actual data allows for accurate DCF valuation.
- Complete Forecast Control: Modify revenue growth, profit margins, WACC, and other essential drivers.
- Real-Time Calculations: Instant updates ensure you see the effects of your changes immediately.
- Professional-Grade Template: A polished Excel spreadsheet crafted for high-quality valuation.
- Flexible and Reusable: Designed for adaptability, enabling multiple uses for in-depth forecasting.
Key Features
- Comprehensive Data Set: Tokyo Seimitsu Co., Ltd.'s historical financial reports and predefined forecasts.
- Customizable Parameters: Adjust WACC, tax rates, revenue growth, and EBITDA margins as needed.
- Real-Time Calculations: Instantly view the intrinsic value of Tokyo Seimitsu Co., Ltd. recalibrating live.
- Informative Visualizations: Dashboard graphs illustrate valuation results and essential metrics.
- Designed for Precision: A high-quality tool tailored for analysts, investors, and finance professionals.
How It Works
- 1. Access the Template: Download and open the Excel file featuring Tokyo Seimitsu Co., Ltd.'s (7729T) preloaded data.
- 2. Modify Assumptions: Adjust key parameters such as growth rates, WACC, and capital expenditures to suit your analysis.
- 3. View Results in Real-Time: The DCF model automatically calculates the intrinsic value and NPV for you.
- 4. Explore Scenarios: Evaluate various forecasts to understand different valuation scenarios for Tokyo Seimitsu Co., Ltd. (7729T).
- 5. Make Informed Decisions: Present professional valuation insights to bolster your investment decisions.
Why Opt for This Calculator?
- Designed for Experts: A sophisticated tool tailored for analysts, CFOs, and consultants in the finance sector.
- Accurate Financial Data: Tokyo Seimitsu Co., Ltd.’s historical and projected financials preloaded for precision.
- Flexible Scenario Analysis: Effortlessly simulate various forecasts and assumptions.
- Concise Results: Instantly computes intrinsic value, NPV, and essential metrics.
- User-Friendly Guide: Comprehensive step-by-step instructions facilitate a smooth experience.
Who Should Use This Product?
- Investors: Accurately assess Tokyo Seimitsu Co., Ltd.'s (7729T) fair value prior to making investment choices.
- CFOs: Utilize a professional-grade DCF model for financial reporting and comprehensive analysis of Tokyo Seimitsu Co., Ltd. (7729T).
- Consultants: Easily customize the template for valuation reports tailored to clients involving Tokyo Seimitsu Co., Ltd. (7729T).
- Entrepreneurs: Discover insights into financial modeling practices employed by leading companies, including Tokyo Seimitsu Co., Ltd. (7729T).
- Educators: Implement it as a teaching resource to showcase various valuation methodologies relating to Tokyo Seimitsu Co., Ltd. (7729T).
What the Template Contains
- Historical Data: Features Tokyo Seimitsu's past financial information and foundational forecasts.
- DCF and Levered DCF Models: Comprehensive templates designed to assess Tokyo Seimitsu's intrinsic value.
- WACC Sheet: Pre-configured calculations for the Weighted Average Cost of Capital.
- Editable Inputs: Adjust essential factors such as growth rates, EBITDA %, and CAPEX assumptions.
- Quarterly and Annual Statements: An exhaustive analysis of Tokyo Seimitsu's financial performance.
- Interactive Dashboard: Dynamically visualize valuation outcomes and projections.
Disclaimer
All information, articles, and product details provided on this website are for general informational and educational purposes only. We do not claim any ownership over, nor do we intend to infringe upon, any trademarks, copyrights, logos, brand names, or other intellectual property mentioned or depicted on this site. Such intellectual property remains the property of its respective owners, and any references here are made solely for identification or informational purposes, without implying any affiliation, endorsement, or partnership.
We make no representations or warranties, express or implied, regarding the accuracy, completeness, or suitability of any content or products presented. Nothing on this website should be construed as legal, tax, investment, financial, medical, or other professional advice. In addition, no part of this site—including articles or product references—constitutes a solicitation, recommendation, endorsement, advertisement, or offer to buy or sell any securities, franchises, or other financial instruments, particularly in jurisdictions where such activity would be unlawful.
All content is of a general nature and may not address the specific circumstances of any individual or entity. It is not a substitute for professional advice or services. Any actions you take based on the information provided here are strictly at your own risk. You accept full responsibility for any decisions or outcomes arising from your use of this website and agree to release us from any liability in connection with your use of, or reliance upon, the content or products found herein.