
|
Screen Holdings Co., Ltd. (7735.t) DCF -Bewertung |
Fully Editable: Tailor To Your Needs In Excel Or Sheets
Professional Design: Trusted, Industry-Standard Templates
Investor-Approved Valuation Models
MAC/PC Compatible, Fully Unlocked
No Expertise Is Needed; Easy To Follow
SCREEN Holdings Co., Ltd. (7735.T) Bundle
Möchten Sie den inneren Wert von Screen Holdings Co., Ltd. beurteilen? Unser (7735T) DCF-Taschenrechner integriert reale Daten mit umfangreichen Anpassungsoptionen, sodass Sie Prognosen anpassen und Ihre Anlagestrategien verbessern können.
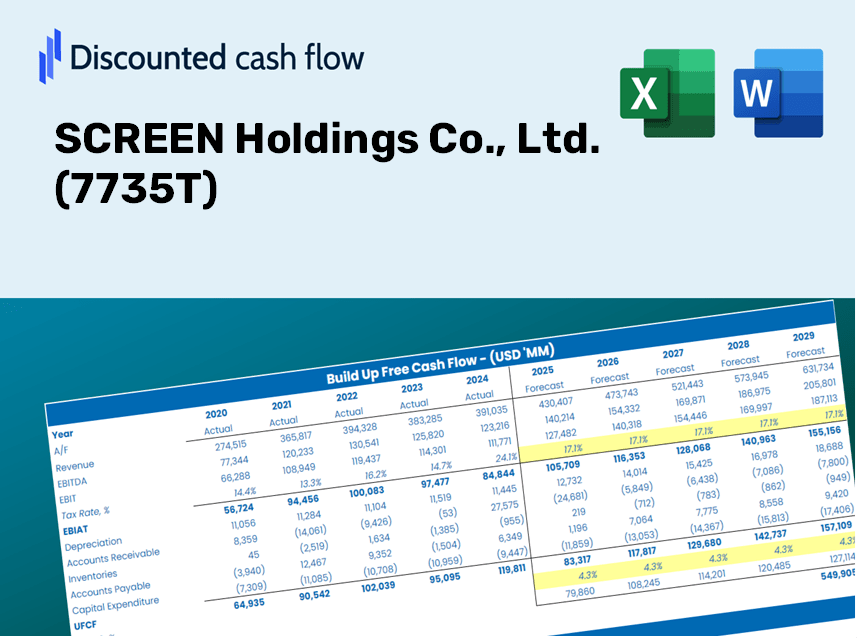
Discounted Cash Flow (DCF) - (USD MM)
| Year | AY1 2021 |
AY2 2022 |
AY3 2023 |
AY4 2024 |
AY5 2025 |
FY1 2026 |
FY2 2027 |
FY3 2028 |
FY4 2029 |
FY5 2030 |
|---|---|---|---|---|---|---|---|---|---|---|
| Revenue | 320,322.0 | 411,865.0 | 460,834.0 | 504,916.0 | 625,269.0 | 740,740.5 | 877,536.6 | 1,039,595.6 | 1,231,582.8 | 1,459,025.2 |
| Revenue Growth, % | 0 | 28.58 | 11.89 | 9.57 | 23.84 | 18.47 | 18.47 | 18.47 | 18.47 | 18.47 |
| EBITDA | 30,804.0 | 66,581.0 | 87,535.0 | 105,192.0 | 151,972.0 | 133,208.6 | 157,808.9 | 186,952.2 | 221,477.6 | 262,378.9 |
| EBITDA, % | 9.62 | 16.17 | 18.99 | 20.83 | 24.31 | 17.98 | 17.98 | 17.98 | 17.98 | 17.98 |
| Depreciation | 9,628.0 | 9,500.0 | 8,799.0 | 10,837.0 | 12,831.0 | 16,918.6 | 20,043.0 | 23,744.5 | 28,129.5 | 33,324.3 |
| Depreciation, % | 3.01 | 2.31 | 1.91 | 2.15 | 2.05 | 2.28 | 2.28 | 2.28 | 2.28 | 2.28 |
| EBIT | 21,176.0 | 57,081.0 | 78,736.0 | 94,355.0 | 139,141.0 | 116,290.0 | 137,765.9 | 163,207.8 | 193,348.1 | 229,054.7 |
| EBIT, % | 6.61 | 13.86 | 17.09 | 18.69 | 22.25 | 15.7 | 15.7 | 15.7 | 15.7 | 15.7 |
| Total Cash | 62,727.0 | 133,088.0 | 175,576.0 | 197,279.0 | 200,397.0 | 238,691.7 | 282,772.1 | 334,993.0 | 396,857.8 | 470,147.4 |
| Total Cash, percent | .0 | .0 | .0 | .0 | .0 | .0 | .0 | .0 | .0 | .0 |
| Account Receivables | 85,566.0 | 90,311.0 | 106,346.0 | 107,653.0 | 95,579.0 | 160,479.5 | 190,116.1 | 225,225.7 | 266,819.2 | 316,094.1 |
| Account Receivables, % | 26.71 | 21.93 | 23.08 | 21.32 | 15.29 | 21.66 | 21.66 | 21.66 | 21.66 | 21.66 |
| Inventories | 95,677.0 | 103,737.0 | 123,875.0 | 163,578.0 | 168,660.0 | 209,344.8 | 248,005.6 | 293,806.0 | 348,064.5 | 412,343.3 |
| Inventories, % | 29.87 | 25.19 | 26.88 | 32.4 | 26.97 | 28.26 | 28.26 | 28.26 | 28.26 | 28.26 |
| Accounts Payable | 28,243.0 | 33,498.0 | 41,300.0 | 41,617.0 | 53,005.0 | 63,158.3 | 74,822.0 | 88,639.7 | 105,009.3 | 124,401.8 |
| Accounts Payable, % | 8.82 | 8.13 | 8.96 | 8.24 | 8.48 | 8.53 | 8.53 | 8.53 | 8.53 | 8.53 |
| Capital Expenditure | -6,716.0 | -10,151.0 | -20,795.0 | -40,337.0 | -21,786.0 | -30,439.8 | -36,061.3 | -42,720.9 | -50,610.3 | -59,956.8 |
| Capital Expenditure, % | -2.1 | -2.46 | -4.51 | -7.99 | -3.48 | -4.11 | -4.11 | -4.11 | -4.11 | -4.11 |
| Tax Rate, % | 28.44 | 28.44 | 28.44 | 28.44 | 28.44 | 28.44 | 28.44 | 28.44 | 28.44 | 28.44 |
| EBITAT | 15,533.0 | 45,729.4 | 57,652.8 | 70,726.7 | 99,564.6 | 86,799.4 | 102,829.1 | 121,819.1 | 144,316.0 | 170,967.5 |
| Depreciation | ||||||||||
| Changes in Account Receivables | ||||||||||
| Changes in Inventories | ||||||||||
| Changes in Accounts Payable | ||||||||||
| Capital Expenditure | ||||||||||
| UFCF | -134,555.0 | 37,528.4 | 17,285.8 | 533.7 | 108,989.6 | -22,153.9 | 30,177.3 | 35,750.3 | 42,352.5 | 50,174.0 |
| WACC, % | 9.9 | 9.9 | 9.9 | 9.9 | 9.9 | 9.9 | 9.9 | 9.9 | 9.9 | 9.9 |
| PV UFCF | ||||||||||
| SUM PV UFCF | 92,089.5 | |||||||||
| Long Term Growth Rate, % | 2.00 | |||||||||
| Free cash flow (T + 1) | 51,177 | |||||||||
| Terminal Value | 647,824 | |||||||||
| Present Terminal Value | 404,083 | |||||||||
| Enterprise Value | 496,172 | |||||||||
| Net Debt | -135,835 | |||||||||
| Equity Value | 632,007 | |||||||||
| Diluted Shares Outstanding, MM | 97 | |||||||||
| Equity Value Per Share | 6,495.79 |
What You Will Receive
- Flexible Forecast Inputs: Modify key assumptions (growth %, margins, WACC) to explore various scenarios.
- Comprehensive Data: SCREEN Holdings Co., Ltd.'s (7735T) financial information pre-loaded to accelerate your analysis.
- Instant DCF Results: The model automatically computes Net Present Value (NPV) and intrinsic value for your convenience.
- Tailorable and Professional: A sleek Excel framework that adjusts to meet your valuation requirements.
- Designed for Analysts and Investors: Perfect for evaluating projections, validating strategies, and enhancing efficiency.
Key Features
- Pre-Loaded Data: SCREEN Holdings Co., Ltd.'s historical financial statements and pre-filled forecasts.
- Fully Adjustable Inputs: Tailor WACC, tax rates, revenue growth, and EBITDA margins to your needs.
- Instant Results: View SCREEN Holdings Co., Ltd.'s intrinsic value recalibrated in real-time.
- Clear Visual Outputs: Dashboard charts provide a visual representation of valuation results and key metrics.
- Built for Accuracy: A professional-grade tool designed for analysts, investors, and finance professionals.
How It Works
- Step 1: Download the Excel file for SCREEN Holdings Co., Ltd. (7735T).
- Step 2: Examine the pre-filled financial data and forecasts for SCREEN.
- Step 3: Adjust key inputs such as revenue growth, WACC, and tax rates (highlighted cells).
- Step 4: Observe the DCF model update in real time as you modify your assumptions.
- Step 5: Review the outputs and leverage the results for your investment strategies.
Why Choose the SCREEN Holdings Co., Ltd. [7735T] Calculator?
- Time Efficiency: Skip the hassle of building a DCF model from the ground up – it's ready for immediate use.
- Enhanced Accuracy: Dependable financial data and formulas minimize valuation errors.
- Completely Customizable: Adjust the model to align with your specific assumptions and forecasts.
- User-Friendly Interface: Intuitive charts and outputs simplify the analysis of results.
- Endorsed by Industry Professionals: Crafted for experts who prioritize precision and ease of use.
Who Should Consider SCREEN Holdings Co., Ltd. (7735T)?
- Investors: Gain insights and make informed investment choices with an industry-leading valuation tool.
- Financial Analysts: Streamline your workflow with a pre-designed DCF model that you can easily tailor.
- Consultants: Efficiently modify the template to suit your client presentations or analytical reports.
- Finance Enthusiasts: Enhance your knowledge of valuation methods through practical, real-world applications.
- Educators and Students: Utilize this resource as an effective learning aid in finance-focused educational programs.
Contents of the Template
- In-Depth DCF Model: Editable template featuring comprehensive valuation calculations.
- Real-World Data: SCREEN Holdings Co., Ltd.'s (7735T) historical and projected financial figures preloaded for analysis.
- Customizable Inputs: Modify WACC, growth rates, and tax assumptions to explore various scenarios.
- Financial Statements: Complete annual and quarterly financial breakdowns for enhanced insights.
- Key Financial Ratios: Integrated analysis tools for assessing profitability, efficiency, and leverage.
- Visual Dashboard: Charts and tables to present clear, actionable results.
Disclaimer
All information, articles, and product details provided on this website are for general informational and educational purposes only. We do not claim any ownership over, nor do we intend to infringe upon, any trademarks, copyrights, logos, brand names, or other intellectual property mentioned or depicted on this site. Such intellectual property remains the property of its respective owners, and any references here are made solely for identification or informational purposes, without implying any affiliation, endorsement, or partnership.
We make no representations or warranties, express or implied, regarding the accuracy, completeness, or suitability of any content or products presented. Nothing on this website should be construed as legal, tax, investment, financial, medical, or other professional advice. In addition, no part of this site—including articles or product references—constitutes a solicitation, recommendation, endorsement, advertisement, or offer to buy or sell any securities, franchises, or other financial instruments, particularly in jurisdictions where such activity would be unlawful.
All content is of a general nature and may not address the specific circumstances of any individual or entity. It is not a substitute for professional advice or services. Any actions you take based on the information provided here are strictly at your own risk. You accept full responsibility for any decisions or outcomes arising from your use of this website and agree to release us from any liability in connection with your use of, or reliance upon, the content or products found herein.