
|
Canon Inc. (7751.t) DCF -Bewertung |
Fully Editable: Tailor To Your Needs In Excel Or Sheets
Professional Design: Trusted, Industry-Standard Templates
Investor-Approved Valuation Models
MAC/PC Compatible, Fully Unlocked
No Expertise Is Needed; Easy To Follow
Canon Inc. (7751.T) Bundle
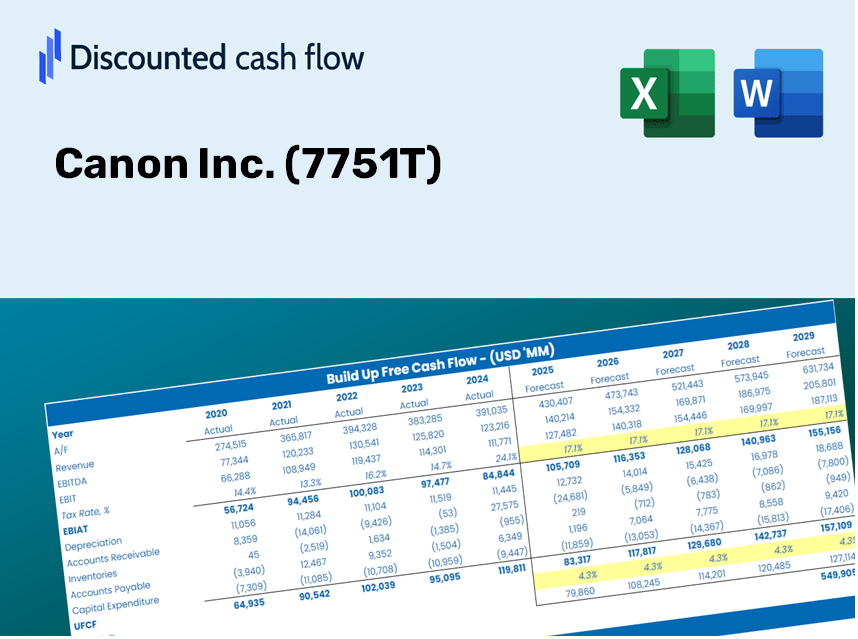
Gewinnen Sie einen Einblick in Ihre Bewertungsanalyse von Canon Inc. (7751T) mit unserem ausgeklügelten DCF -Taschenrechner! Mit realen Daten für (7751T) geladen, können Sie diese Excel -Vorlage für die Anpassung von Prognosen und Annahmen ermöglichen, um den inneren Wert von Canon Inc. genau zu bestimmen.
Discounted Cash Flow (DCF) - (USD MM)
| Year | AY1 2020 |
AY2 2021 |
AY3 2022 |
AY4 2023 |
AY5 2024 |
FY1 2025 |
FY2 2026 |
FY3 2027 |
FY4 2028 |
FY5 2029 |
|---|---|---|---|---|---|---|---|---|---|---|
| Revenue | 3,160,243.0 | 3,513,357.0 | 4,031,414.0 | 4,180,972.0 | 4,509,821.0 | 4,932,551.1 | 5,394,905.9 | 5,900,599.8 | 6,453,695.2 | 7,058,635.2 |
| Revenue Growth, % | 0 | 11.17 | 14.75 | 3.71 | 7.87 | 9.37 | 9.37 | 9.37 | 9.37 | 9.37 |
| EBITDA | 358,959.0 | 524,599.0 | 579,978.0 | 631,710.0 | 540,371.0 | 668,537.0 | 731,202.6 | 799,742.2 | 874,706.4 | 956,697.4 |
| EBITDA, % | 11.36 | 14.93 | 14.39 | 15.11 | 11.98 | 13.55 | 13.55 | 13.55 | 13.55 | 13.55 |
| Depreciation | 227,825.0 | 221,246.0 | 226,492.0 | 238,676.0 | 235,465.0 | 296,489.2 | 324,280.7 | 354,677.3 | 387,923.1 | 424,285.3 |
| Depreciation, % | 7.21 | 6.3 | 5.62 | 5.71 | 5.22 | 6.01 | 6.01 | 6.01 | 6.01 | 6.01 |
| EBIT | 131,134.0 | 303,353.0 | 353,486.0 | 393,034.0 | 304,906.0 | 372,047.8 | 406,921.9 | 445,064.9 | 486,783.3 | 532,412.1 |
| EBIT, % | 4.15 | 8.63 | 8.77 | 9.4 | 6.76 | 7.54 | 7.54 | 7.54 | 7.54 | 7.54 |
| Total Cash | 407,755.0 | 404,772.0 | 373,006.0 | 405,145.0 | 506,340.0 | 538,573.3 | 589,056.7 | 644,272.2 | 704,663.3 | 770,715.3 |
| Total Cash, percent | .0 | .0 | .0 | .0 | .0 | .0 | .0 | .0 | .0 | .0 |
| Account Receivables | 535,126.0 | 629,840.0 | 895,644.0 | 835,809.0 | 688,630.0 | 910,914.4 | 996,299.4 | 1,089,687.9 | 1,191,830.3 | 1,303,547.0 |
| Account Receivables, % | 16.93 | 17.93 | 22.22 | 19.99 | 15.27 | 18.47 | 18.47 | 18.47 | 18.47 | 18.47 |
| Inventories | 562,807.0 | 650,568.0 | 808,312.0 | 796,881.0 | 841,836.0 | 928,333.1 | 1,015,350.8 | 1,110,525.2 | 1,214,620.8 | 1,328,473.8 |
| Inventories, % | 17.81 | 18.52 | 20.05 | 19.06 | 18.67 | 18.82 | 18.82 | 18.82 | 18.82 | 18.82 |
| Accounts Payable | 303,809.0 | 338,604.0 | 355,930.0 | 309,930.0 | 350,128.0 | 426,730.3 | 466,730.0 | 510,479.2 | 558,329.2 | 610,664.4 |
| Accounts Payable, % | 9.61 | 9.64 | 8.83 | 7.41 | 7.76 | 8.65 | 8.65 | 8.65 | 8.65 | 8.65 |
| Capital Expenditure | -164,719.0 | -177,350.0 | -188,527.0 | -230,308.0 | -237,001.0 | -253,535.6 | -277,300.9 | -303,293.8 | -331,723.2 | -362,817.4 |
| Capital Expenditure, % | -5.21 | -5.05 | -4.68 | -5.51 | -5.26 | -5.14 | -5.14 | -5.14 | -5.14 | -5.14 |
| Tax Rate, % | 46.86 | 46.86 | 46.86 | 46.86 | 46.86 | 46.86 | 46.86 | 46.86 | 46.86 | 46.86 |
| EBITAT | 83,864.2 | 215,176.9 | 244,685.0 | 266,047.5 | 162,014.9 | 241,781.4 | 264,444.9 | 289,232.7 | 316,344.1 | 345,996.8 |
| Depreciation | ||||||||||
| Changes in Account Receivables | ||||||||||
| Changes in Inventories | ||||||||||
| Changes in Accounts Payable | ||||||||||
| Capital Expenditure | ||||||||||
| UFCF | -647,153.8 | 111,392.9 | -123,572.0 | 299,681.5 | 302,900.9 | 52,555.7 | 179,021.8 | 195,802.4 | 214,156.1 | 234,230.1 |
| WACC, % | 4.39 | 4.42 | 4.41 | 4.4 | 4.33 | 4.39 | 4.39 | 4.39 | 4.39 | 4.39 |
| PV UFCF | ||||||||||
| SUM PV UFCF | 756,017.7 | |||||||||
| Long Term Growth Rate, % | 2.00 | |||||||||
| Free cash flow (T + 1) | 238,915 | |||||||||
| Terminal Value | 9,992,203 | |||||||||
| Present Terminal Value | 8,060,199 | |||||||||
| Enterprise Value | 8,816,216 | |||||||||
| Net Debt | 161,935 | |||||||||
| Equity Value | 8,654,281 | |||||||||
| Diluted Shares Outstanding, MM | 967 | |||||||||
| Equity Value Per Share | 8,947.45 |
Benefits of Choosing Canon Inc. (7751T)
- Authentic Canon Financials: Access to both historical and projected data for reliable valuation insights.
- Customizable Parameters: Adjust factors such as WACC, tax rates, revenue growth, and capital expenditures.
- Dynamic Calculations: Automatic computation of intrinsic value and NPV for real-time analysis.
- Comprehensive Scenario Analysis: Explore various scenarios to assess Canon’s projected performance.
- User-Friendly Interface: Designed with professionals in mind, yet simple enough for newcomers.
Key Features
- Authentic Canon Financials: Access reliable pre-loaded historical data and future forecasts.
- Adjustable Forecast Assumptions: Modify yellow-highlighted fields such as WACC, growth rates, and profit margins.
- Dynamic Calculations: Automatic updates for DCF, Net Present Value (NPV), and cash flow analysis.
- Interactive Dashboard: User-friendly charts and summaries to help visualize your valuation outcomes.
- Designed for Everyone: An intuitive layout tailored for investors, CFOs, and consultants alike.
How It Operates
- Step 1: Download the Excel spreadsheet.
- Step 2: Examine the pre-filled Canon data (historical and forecasted).
- Step 3: Modify key assumptions (yellow cells) according to your analysis.
- Step 4: Observe automatic recalculations for Canon’s intrinsic value.
- Step 5: Utilize the results for investment strategies or reporting purposes.
Why Opt for This Calculator?
- Designed for Professionals: A sophisticated tool utilized by analysts, CFOs, and consultants.
- Comprehensive Data: Canon’s historical and projected financials are preloaded for precision.
- Scenario Simulation: Effortlessly test various forecasts and assumptions.
- Clear Outputs: Automatically provides intrinsic value, NPV, and essential metrics.
- User-Friendly: Step-by-step guidance to ensure a smooth experience.
Who Should Use This Product?
- Finance Students: Master valuation methods and apply them to real-world data from Canon Inc. (7751T).
- Academics: Integrate industry-standard models into your teaching or research on Canon Inc. (7751T).
- Investors: Evaluate your investment strategies and assess valuation scenarios for Canon Inc. (7751T) stock.
- Analysts: Enhance your analytical process with a customizable, ready-to-use DCF model for Canon Inc. (7751T).
- Small Business Owners: Understand the valuation techniques used in analyzing major corporations like Canon Inc. (7751T).
Contents of the Template
- Pre-Filled Data: Features Canon Inc.'s (7751T) historical financial performance and projections.
- Discounted Cash Flow Model: An editable DCF valuation model with built-in calculations.
- Weighted Average Cost of Capital (WACC): A specific sheet for determining WACC based on your inputs.
- Key Financial Ratios: Evaluate Canon Inc.'s (7751T) profitability, efficiency, and leverage metrics.
- Customizable Inputs: Easily adjust revenue growth, margins, and tax rates.
- Clear Dashboard: Visual charts and tables presenting essential valuation outcomes.
Disclaimer
All information, articles, and product details provided on this website are for general informational and educational purposes only. We do not claim any ownership over, nor do we intend to infringe upon, any trademarks, copyrights, logos, brand names, or other intellectual property mentioned or depicted on this site. Such intellectual property remains the property of its respective owners, and any references here are made solely for identification or informational purposes, without implying any affiliation, endorsement, or partnership.
We make no representations or warranties, express or implied, regarding the accuracy, completeness, or suitability of any content or products presented. Nothing on this website should be construed as legal, tax, investment, financial, medical, or other professional advice. In addition, no part of this site—including articles or product references—constitutes a solicitation, recommendation, endorsement, advertisement, or offer to buy or sell any securities, franchises, or other financial instruments, particularly in jurisdictions where such activity would be unlawful.
All content is of a general nature and may not address the specific circumstances of any individual or entity. It is not a substitute for professional advice or services. Any actions you take based on the information provided here are strictly at your own risk. You accept full responsibility for any decisions or outcomes arising from your use of this website and agree to release us from any liability in connection with your use of, or reliance upon, the content or products found herein.