
|
Shoei Co., Limited (7839.T) DCF -Bewertung |
Fully Editable: Tailor To Your Needs In Excel Or Sheets
Professional Design: Trusted, Industry-Standard Templates
Investor-Approved Valuation Models
MAC/PC Compatible, Fully Unlocked
No Expertise Is Needed; Easy To Follow
Shoei Co., Limited (7839.T) Bundle
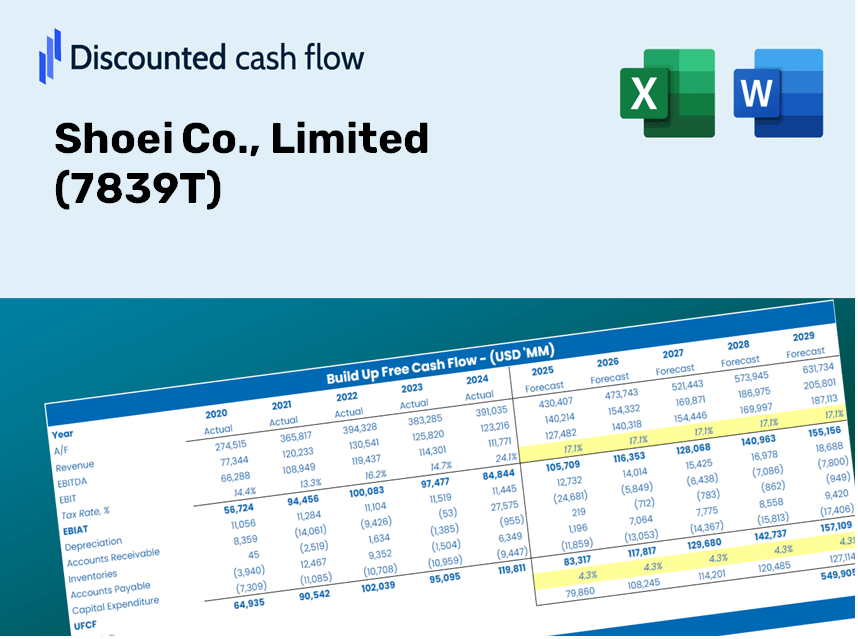
Gewinnen Sie mit unserem modernsten DCF-Taschenrechner eine Meisterschaft über Ihre Schuh-Co.-Bewertungsanalyse (7839T)! Diese Excel -Vorlage mit genauen (7839T) Daten vorinstalliert und ermöglicht es Ihnen, Prognosen und Annahmen anzupassen, um die intrinsische Wert von Limited Co. Co. Co. genau zu berechnen.
Discounted Cash Flow (DCF) - (USD MM)
| Year | AY1 2020 |
AY2 2021 |
AY3 2022 |
AY4 2023 |
AY5 2024 |
FY1 2025 |
FY2 2026 |
FY3 2027 |
FY4 2028 |
FY5 2029 |
|---|---|---|---|---|---|---|---|---|---|---|
| Revenue | 19,479.7 | 23,752.5 | 28,953.5 | 33,616.7 | 35,790.7 | 41,732.4 | 48,660.4 | 56,738.6 | 66,157.8 | 77,140.7 |
| Revenue Growth, % | 0 | 21.94 | 21.9 | 16.11 | 6.47 | 16.6 | 16.6 | 16.6 | 16.6 | 16.6 |
| EBITDA | 5,661.3 | 7,192.3 | 9,524.9 | 11,354.5 | 12,234.2 | 13,371.0 | 15,590.7 | 18,179.0 | 21,196.9 | 24,715.8 |
| EBITDA, % | 29.06 | 30.28 | 32.9 | 33.78 | 34.18 | 32.04 | 32.04 | 32.04 | 32.04 | 32.04 |
| Depreciation | 907.3 | 1,091.5 | 1,014.1 | 1,486.4 | 1,737.3 | 1,838.9 | 2,144.1 | 2,500.1 | 2,915.1 | 3,399.1 |
| Depreciation, % | 4.66 | 4.6 | 3.5 | 4.42 | 4.85 | 4.41 | 4.41 | 4.41 | 4.41 | 4.41 |
| EBIT | 4,754.0 | 6,100.8 | 8,510.8 | 9,868.1 | 10,496.9 | 11,532.1 | 13,446.6 | 15,678.9 | 18,281.7 | 21,316.7 |
| EBIT, % | 24.4 | 25.68 | 29.39 | 29.35 | 29.33 | 27.63 | 27.63 | 27.63 | 27.63 | 27.63 |
| Total Cash | 9,383.1 | 11,426.1 | 13,887.2 | 14,767.3 | 15,352.4 | 19,285.4 | 22,487.0 | 26,220.1 | 30,572.9 | 35,648.4 |
| Total Cash, percent | .0 | .0 | .0 | .0 | .0 | .0 | .0 | .0 | .0 | .0 |
| Account Receivables | 1,926.1 | 2,391.1 | 3,225.6 | 2,632.4 | 2,960.4 | 3,939.3 | 4,593.2 | 5,355.8 | 6,244.9 | 7,281.6 |
| Account Receivables, % | 9.89 | 10.07 | 11.14 | 7.83 | 8.27 | 9.44 | 9.44 | 9.44 | 9.44 | 9.44 |
| Inventories | 4,204.8 | 3,683.6 | 4,910.5 | 6,221.4 | 6,680.0 | 7,614.0 | 8,878.0 | 10,351.9 | 12,070.4 | 14,074.2 |
| Inventories, % | 21.59 | 15.51 | 16.96 | 18.51 | 18.66 | 18.24 | 18.24 | 18.24 | 18.24 | 18.24 |
| Accounts Payable | 1,658.3 | 728.1 | 1,344.6 | 485.9 | 1,167.6 | 1,746.9 | 2,036.9 | 2,375.0 | 2,769.3 | 3,229.1 |
| Accounts Payable, % | 8.51 | 3.07 | 4.64 | 1.45 | 3.26 | 4.19 | 4.19 | 4.19 | 4.19 | 4.19 |
| Capital Expenditure | -1,272.1 | -1,239.2 | -1,702.7 | -2,296.7 | -3,231.0 | -2,795.0 | -3,259.0 | -3,800.0 | -4,430.9 | -5,166.5 |
| Capital Expenditure, % | -6.53 | -5.22 | -5.88 | -6.83 | -9.03 | -6.7 | -6.7 | -6.7 | -6.7 | -6.7 |
| Tax Rate, % | 29.56 | 29.56 | 29.56 | 29.56 | 29.56 | 29.56 | 29.56 | 29.56 | 29.56 | 29.56 |
| EBITAT | 3,352.5 | 4,412.1 | 6,023.7 | 7,075.1 | 7,393.8 | 8,205.2 | 9,567.3 | 11,155.6 | 13,007.6 | 15,166.9 |
| Depreciation | ||||||||||
| Changes in Account Receivables | ||||||||||
| Changes in Inventories | ||||||||||
| Changes in Accounts Payable | ||||||||||
| Capital Expenditure | ||||||||||
| UFCF | -1,484.7 | 3,390.4 | 3,890.3 | 4,688.4 | 5,795.3 | 5,915.4 | 6,824.5 | 7,957.4 | 9,278.4 | 10,818.8 |
| WACC, % | 7.52 | 7.52 | 7.52 | 7.52 | 7.52 | 7.52 | 7.52 | 7.52 | 7.52 | 7.52 |
| PV UFCF | ||||||||||
| SUM PV UFCF | 32,281.5 | |||||||||
| Long Term Growth Rate, % | 1.00 | |||||||||
| Free cash flow (T + 1) | 10,927 | |||||||||
| Terminal Value | 167,683 | |||||||||
| Present Terminal Value | 116,712 | |||||||||
| Enterprise Value | 148,993 | |||||||||
| Net Debt | -14,840 | |||||||||
| Equity Value | 163,833 | |||||||||
| Diluted Shares Outstanding, MM | 53 | |||||||||
| Equity Value Per Share | 3,106.75 |
What You Will Receive
- Customizable Excel Template: A fully editable Excel-based DCF Calculator featuring pre-populated financial data for Shoei Co., Limited (7839T).
- Accurate Data: Access to historical performance data and forward-looking projections (visible in the highlighted yellow cells).
- Adaptable Forecasts: Modify key assumptions such as revenue growth, EBITDA percentage, and WACC.
- Instant Calculations: Observe the direct effects of your input changes on the valuation of Shoei Co., Limited (7839T).
- Professional-Grade Tool: Designed for investors, CFOs, consultants, and financial analysts.
- User-Friendly Interface: Organized for straightforward navigation and includes step-by-step guidance.
Key Features
- Genuine Financial Data for Shoei Co., Limited (7839T): Access reliable historical figures and future estimates.
- Adjustable Forecast Parameters: Modify the highlighted cells for WACC, growth rates, and profit margins.
- Real-time Calculations: Automatic refresh of DCF, Net Present Value (NPV), and cash flow assessments.
- User-friendly Dashboard: Clear and informative charts and summaries to illustrate your valuation insights.
- Suitable for All Skill Levels: An accessible, straightforward design tailored for investors, CFOs, and consultants.
How It Works
- Step 1: Download the Excel spreadsheet.
- Step 2: Review the pre-populated data for Shoei Co., Limited (7839T), including historical and projected figures.
- Step 3: Modify the key assumptions (highlighted in yellow) according to your analysis.
- Step 4: Observe the automatic recalculations of Shoei’s intrinsic value.
- Step 5: Utilize the results to inform your investment strategies or financial reporting.
Why Opt for This Calculator?
- Reliable Data: Access authentic Shoei Co., Limited (7839T) financial information for trustworthy valuation outcomes.
- Flexible: Modify essential variables such as growth rates, WACC, and tax rates to fit your specific forecasts.
- Efficient: Built-in calculations save you the hassle of starting from the ground up.
- Professional Quality: Tailored for investors, analysts, and consultants seeking precision.
- Easy to Use: User-friendly design and clear instructions ensure accessibility for everyone.
Who Can Benefit from This Product?
- Investors: Evaluate the valuation of Shoei Co., Limited (7839T) prior to making stock transactions.
- CFOs and Financial Analysts: Optimize valuation workflows and validate forecasts.
- Startup Founders: Discover how leading public firms like Shoei Co., Limited (7839T) are appraised.
- Consultants: Provide clients with comprehensive valuation reports.
- Students and Educators: Utilize real market data to enhance learning and practice valuation methods.
Components of the Template
- Comprehensive DCF Model: An editable template featuring in-depth valuation calculations.
- Real-World Data: Shoei Co., Limited's (7839T) historical and projected financials preloaded for thorough analysis.
- Customizable Parameters: Modify WACC, growth rates, and tax assumptions to explore various scenarios.
- Financial Statements: Complete annual and quarterly breakdowns for enhanced insights.
- Key Ratios: Integrated analysis for assessing profitability, efficiency, and leverage issues.
- Dashboard with Visual Outputs: Charts and tables to present clear, actionable results.
Disclaimer
All information, articles, and product details provided on this website are for general informational and educational purposes only. We do not claim any ownership over, nor do we intend to infringe upon, any trademarks, copyrights, logos, brand names, or other intellectual property mentioned or depicted on this site. Such intellectual property remains the property of its respective owners, and any references here are made solely for identification or informational purposes, without implying any affiliation, endorsement, or partnership.
We make no representations or warranties, express or implied, regarding the accuracy, completeness, or suitability of any content or products presented. Nothing on this website should be construed as legal, tax, investment, financial, medical, or other professional advice. In addition, no part of this site—including articles or product references—constitutes a solicitation, recommendation, endorsement, advertisement, or offer to buy or sell any securities, franchises, or other financial instruments, particularly in jurisdictions where such activity would be unlawful.
All content is of a general nature and may not address the specific circumstances of any individual or entity. It is not a substitute for professional advice or services. Any actions you take based on the information provided here are strictly at your own risk. You accept full responsibility for any decisions or outcomes arising from your use of this website and agree to release us from any liability in connection with your use of, or reliance upon, the content or products found herein.