
|
Yonex Co., Ltd. (7906.t) DCF -Bewertung |
Fully Editable: Tailor To Your Needs In Excel Or Sheets
Professional Design: Trusted, Industry-Standard Templates
Investor-Approved Valuation Models
MAC/PC Compatible, Fully Unlocked
No Expertise Is Needed; Easy To Follow
YONEX Co., Ltd. (7906.T) Bundle
Egal, ob Sie ein Investor oder Analyst sind, dieser DCF -Taschenrechner von Yonex Co., Ltd. (7906T) ist Ihr wesentliches Werkzeug für eine genaue Bewertung. Mit yonex realen Daten vorinstalliert, können Sie Prognosen anpassen und die Auswirkungen sofort beobachten.
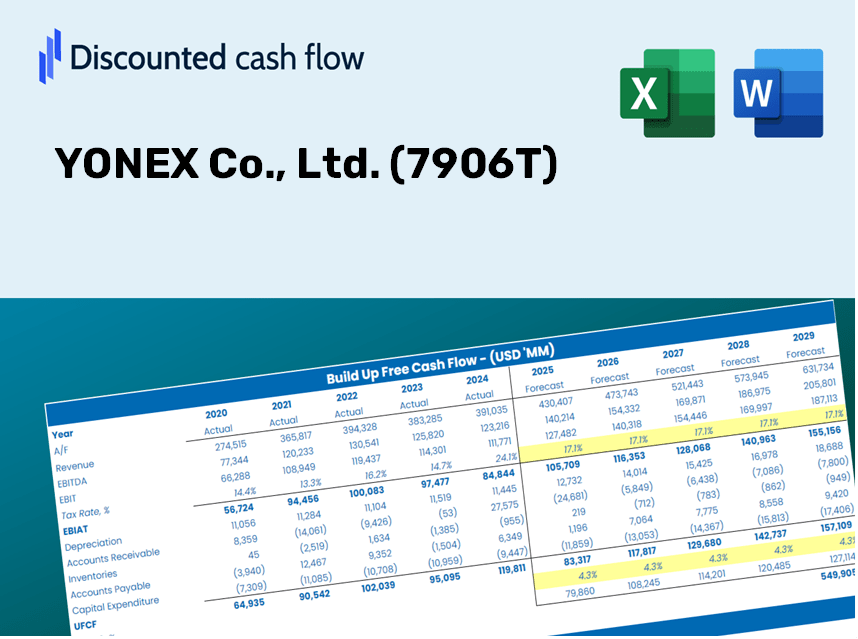
Discounted Cash Flow (DCF) - (USD MM)
| Year | AY1 2021 |
AY2 2022 |
AY3 2023 |
AY4 2024 |
AY5 2025 |
FY1 2026 |
FY2 2027 |
FY3 2028 |
FY4 2029 |
FY5 2030 |
|---|---|---|---|---|---|---|---|---|---|---|
| Revenue | 51,554.1 | 74,485.3 | 107,019.0 | 116,442.0 | 138,276.0 | 178,277.1 | 229,850.0 | 296,342.1 | 382,069.3 | 492,596.1 |
| Revenue Growth, % | 0 | 44.48 | 43.68 | 8.8 | 18.75 | 28.93 | 28.93 | 28.93 | 28.93 | 28.93 |
| EBITDA | 3,823.1 | 9,586.1 | 12,497.0 | 15,599.0 | 18,316.0 | 20,896.0 | 26,940.8 | 34,734.4 | 44,782.6 | 57,737.5 |
| EBITDA, % | 7.42 | 12.87 | 11.68 | 13.4 | 13.25 | 11.72 | 11.72 | 11.72 | 11.72 | 11.72 |
| Depreciation | 1,678.9 | 1,736.5 | 2,118.0 | 2,797.0 | 3,275.0 | 4,399.0 | 5,671.5 | 7,312.2 | 9,427.6 | 12,154.8 |
| Depreciation, % | 3.26 | 2.33 | 1.98 | 2.4 | 2.37 | 2.47 | 2.47 | 2.47 | 2.47 | 2.47 |
| EBIT | 2,144.2 | 7,849.6 | 10,379.0 | 12,802.0 | 15,041.0 | 16,497.0 | 21,269.3 | 27,422.2 | 35,355.0 | 45,582.7 |
| EBIT, % | 4.16 | 10.54 | 9.7 | 10.99 | 10.88 | 9.25 | 9.25 | 9.25 | 9.25 | 9.25 |
| Total Cash | 13,271.1 | 17,922.8 | 16,912.0 | 23,549.0 | 29,478.0 | 38,204.5 | 49,256.5 | 63,505.6 | 81,876.8 | 105,562.5 |
| Total Cash, percent | .0 | .0 | .0 | .0 | .0 | .0 | .0 | .0 | .0 | .0 |
| Account Receivables | 11,145.2 | 12,647.5 | 14,963.0 | 17,046.0 | 19,927.0 | 29,105.5 | 37,525.3 | 48,380.8 | 62,376.7 | 80,421.3 |
| Account Receivables, % | 21.62 | 16.98 | 13.98 | 14.64 | 14.41 | 16.33 | 16.33 | 16.33 | 16.33 | 16.33 |
| Inventories | 9,172.0 | 11,792.5 | 18,831.0 | 16,742.0 | 20,004.0 | 28,547.0 | 36,805.2 | 47,452.4 | 61,179.7 | 78,878.1 |
| Inventories, % | 17.79 | 15.83 | 17.6 | 14.38 | 14.47 | 16.01 | 16.01 | 16.01 | 16.01 | 16.01 |
| Accounts Payable | 2,977.3 | 4,790.0 | 7,128.0 | 6,390.0 | 10,402.0 | 11,365.8 | 14,653.7 | 18,892.8 | 24,358.2 | 31,404.7 |
| Accounts Payable, % | 5.78 | 6.43 | 6.66 | 5.49 | 7.52 | 6.38 | 6.38 | 6.38 | 6.38 | 6.38 |
| Capital Expenditure | -1,037.5 | -1,698.0 | -4,329.0 | -7,475.0 | -5,801.0 | -6,757.4 | -8,712.2 | -11,232.5 | -14,481.9 | -18,671.3 |
| Capital Expenditure, % | -2.01 | -2.28 | -4.05 | -6.42 | -4.2 | -3.79 | -3.79 | -3.79 | -3.79 | -3.79 |
| Tax Rate, % | 28.87 | 28.87 | 28.87 | 28.87 | 28.87 | 28.87 | 28.87 | 28.87 | 28.87 | 28.87 |
| EBITAT | 1,120.8 | 5,800.7 | 7,370.8 | 8,923.1 | 10,698.0 | 11,152.3 | 14,378.4 | 18,537.9 | 23,900.6 | 30,814.7 |
| Depreciation | ||||||||||
| Changes in Account Receivables | ||||||||||
| Changes in Inventories | ||||||||||
| Changes in Accounts Payable | ||||||||||
| Capital Expenditure | ||||||||||
| UFCF | -15,577.8 | 3,529.1 | -1,856.3 | 3,513.1 | 6,041.0 | -7,963.9 | -2,052.3 | -2,646.0 | -3,411.4 | -4,398.3 |
| WACC, % | 4.45 | 4.47 | 4.47 | 4.47 | 4.47 | 4.46 | 4.46 | 4.46 | 4.46 | 4.46 |
| PV UFCF | ||||||||||
| SUM PV UFCF | -18,225.1 | |||||||||
| Long Term Growth Rate, % | 2.00 | |||||||||
| Free cash flow (T + 1) | -4,486 | |||||||||
| Terminal Value | -182,016 | |||||||||
| Present Terminal Value | -146,305 | |||||||||
| Enterprise Value | -164,530 | |||||||||
| Net Debt | -18,272 | |||||||||
| Equity Value | -146,258 | |||||||||
| Diluted Shares Outstanding, MM | 86 | |||||||||
| Equity Value Per Share | -1,698.10 |
What You Will Receive
- Authentic YONEX Data: Comprehensive financials – from total sales to EBIT – derived from both historical and forecasted data.
- Complete Customization: Modify all key parameters (highlighted in yellow) such as WACC, growth rates, and tax percentages.
- Immediate Valuation Adjustments: Automatic updates that allow you to evaluate how changes affect YONEX's fair market value.
- Flexible Excel Template: Designed for easy modifications, scenario evaluations, and in-depth forecasts.
- Efficient and Precise: Eliminate the need to build models from the ground up while ensuring accuracy and adaptability.
Key Features
- Comprehensive Historical Data: YONEX's past financial statements and pre-filled projections.
- Customizable Inputs: Modify WACC, tax rates, revenue growth, and EBITDA margins as needed.
- Real-Time Insights: Watch YONEX's intrinsic value update instantly.
- Intuitive Visualizations: Dashboard charts present valuation outcomes and essential metrics.
- Designed for Precision: A reliable tool for analysts, investors, and finance professionals.
How It Works
- 1. Access the Template: Download and open the Excel document featuring YONEX Co., Ltd. (7906T) preloaded data.
- 2. Modify Assumptions: Adjust critical inputs such as growth rates, WACC, and capital expenditures.
- 3. Instant Results: The DCF model automatically calculates intrinsic value and NPV in real-time.
- 4. Explore Scenarios: Analyze various forecasts to assess different valuation results.
- 5. Present with Assurance: Showcase professional valuation insights to back your decision-making.
Why Opt for This YONEX Calculator?
- Precise Metrics: Utilize authentic YONEX financial data for dependable valuation outcomes.
- Tailored Options: Modify essential parameters such as growth rates, WACC, and tax rates to align with your forecasts.
- Efficiency Boost: Ready-made calculations save you the hassle of building from the ground up.
- Professional-Quality Tool: Crafted for investors, analysts, and consulting professionals.
- Easy to Navigate: User-friendly design and comprehensive guidance simplify the experience for all users.
Who Should Utilize This Product?
- Investors: Accurately assess the fair value of YONEX Co., Ltd. (7906T) prior to making investment choices.
- CFOs: Utilize a professional-grade DCF model for comprehensive financial reporting and analysis.
- Consultants: Efficiently modify the template for client valuation reports.
- Entrepreneurs: Acquire insights into the financial modeling practices of leading companies.
- Educators: Employ it as a teaching resource to illustrate valuation techniques.
Contents of the Template
- Pre-Filled Data: Comprises YONEX Co., Ltd.'s historical financials and projections.
- Discounted Cash Flow Model: An editable DCF valuation model featuring automated calculations.
- Weighted Average Cost of Capital (WACC): A designated sheet for calculating WACC using tailored inputs.
- Key Financial Ratios: Evaluate YONEX's profitability, efficiency, and financial leverage.
- Customizable Inputs: Easily modify revenue growth rates, profit margins, and tax assumptions.
- Clear Dashboard: Visual representations and tables summarizing the essential valuation findings.
Disclaimer
All information, articles, and product details provided on this website are for general informational and educational purposes only. We do not claim any ownership over, nor do we intend to infringe upon, any trademarks, copyrights, logos, brand names, or other intellectual property mentioned or depicted on this site. Such intellectual property remains the property of its respective owners, and any references here are made solely for identification or informational purposes, without implying any affiliation, endorsement, or partnership.
We make no representations or warranties, express or implied, regarding the accuracy, completeness, or suitability of any content or products presented. Nothing on this website should be construed as legal, tax, investment, financial, medical, or other professional advice. In addition, no part of this site—including articles or product references—constitutes a solicitation, recommendation, endorsement, advertisement, or offer to buy or sell any securities, franchises, or other financial instruments, particularly in jurisdictions where such activity would be unlawful.
All content is of a general nature and may not address the specific circumstances of any individual or entity. It is not a substitute for professional advice or services. Any actions you take based on the information provided here are strictly at your own risk. You accept full responsibility for any decisions or outcomes arising from your use of this website and agree to release us from any liability in connection with your use of, or reliance upon, the content or products found herein.