
|
Dai Nippon Printing Co., Ltd. (7912.t) DCF -Bewertung |
Fully Editable: Tailor To Your Needs In Excel Or Sheets
Professional Design: Trusted, Industry-Standard Templates
Investor-Approved Valuation Models
MAC/PC Compatible, Fully Unlocked
No Expertise Is Needed; Easy To Follow
Dai Nippon Printing Co., Ltd. (7912.T) Bundle
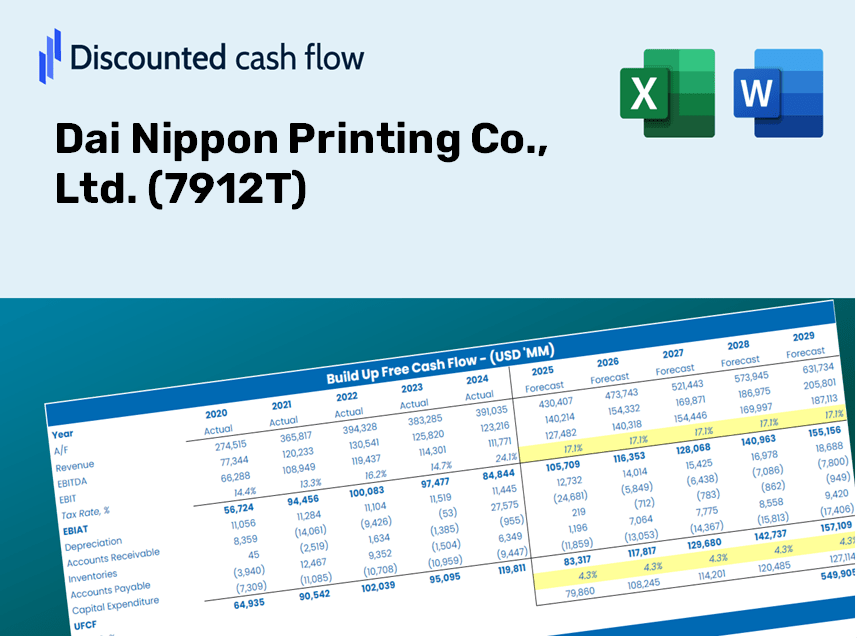
Gewinnen Sie einen Einblick in Ihre DAI Nippon Printing Co., Ltd. (7912t) Bewertungsanalyse mit unserem hochmodernen DCF-Taschenrechner! Diese Excel -Vorlage wird mit realen (7912T) Daten vorinstalliert, sodass Sie Prognosen und Annahmen anpassen können, um den inneren Wert von Dai Nippon Printing Co., Ltd., genau zu berechnen.
Discounted Cash Flow (DCF) - (USD MM)
| Year | AY1 2021 |
AY2 2022 |
AY3 2023 |
AY4 2024 |
AY5 2025 |
FY1 2026 |
FY2 2027 |
FY3 2028 |
FY4 2029 |
FY5 2030 |
|---|---|---|---|---|---|---|---|---|---|---|
| Revenue | 1,335,439.0 | 1,344,147.0 | 1,373,209.0 | 1,424,822.0 | 1,457,609.0 | 1,489,945.6 | 1,522,999.6 | 1,556,786.9 | 1,591,323.8 | 1,626,626.9 |
| Revenue Growth, % | 0 | 0.65207 | 2.16 | 3.76 | 2.3 | 2.22 | 2.22 | 2.22 | 2.22 | 2.22 |
| EBITDA | 99,542.0 | 118,464.0 | 172,714.0 | 200,630.0 | 205,568.0 | 169,939.5 | 173,709.5 | 177,563.2 | 181,502.4 | 185,529.0 |
| EBITDA, % | 7.45 | 8.81 | 12.58 | 14.08 | 14.1 | 11.41 | 11.41 | 11.41 | 11.41 | 11.41 |
| Depreciation | 51,887.0 | 51,675.0 | 52,281.0 | 56,725.0 | 54,335.0 | 57,350.8 | 58,623.1 | 59,923.6 | 61,253.0 | 62,611.9 |
| Depreciation, % | 3.89 | 3.84 | 3.81 | 3.98 | 3.73 | 3.85 | 3.85 | 3.85 | 3.85 | 3.85 |
| EBIT | 47,655.0 | 66,789.0 | 120,433.0 | 143,905.0 | 151,233.0 | 112,588.7 | 115,086.5 | 117,639.6 | 120,249.4 | 122,917.1 |
| EBIT, % | 3.57 | 4.97 | 8.77 | 10.1 | 10.38 | 7.56 | 7.56 | 7.56 | 7.56 | 7.56 |
| Total Cash | 320,162.0 | 305,234.0 | 269,238.0 | 236,265.0 | 254,995.0 | 299,077.6 | 305,712.6 | 312,494.7 | 319,427.3 | 326,513.7 |
| Total Cash, percent | .0 | .0 | .0 | .0 | .0 | .0 | .0 | .0 | .0 | .0 |
| Account Receivables | 323,909.0 | 324,625.0 | 324,845.0 | 348,429.0 | 341,096.0 | 357,339.8 | 365,267.3 | 373,370.6 | 381,653.7 | 390,120.6 |
| Account Receivables, % | 24.25 | 24.15 | 23.66 | 24.45 | 23.4 | 23.98 | 23.98 | 23.98 | 23.98 | 23.98 |
| Inventories | 126,770.0 | 141,620.0 | 154,862.0 | 164,496.0 | 165,726.0 | 161,572.5 | 165,156.9 | 168,820.9 | 172,566.1 | 176,394.4 |
| Inventories, % | 9.49 | 10.54 | 11.28 | 11.55 | 11.37 | 10.84 | 10.84 | 10.84 | 10.84 | 10.84 |
| Accounts Payable | 226,606.0 | 236,188.0 | 224,418.0 | 223,873.0 | 215,474.0 | 242,497.3 | 247,877.0 | 253,376.1 | 258,997.1 | 264,742.9 |
| Accounts Payable, % | 16.97 | 17.57 | 16.34 | 15.71 | 14.78 | 16.28 | 16.28 | 16.28 | 16.28 | 16.28 |
| Capital Expenditure | -61,984.0 | -65,820.0 | -62,125.0 | -74,753.0 | -57,082.0 | -69,207.8 | -70,743.2 | -72,312.6 | -73,916.8 | -75,556.7 |
| Capital Expenditure, % | -4.64 | -4.9 | -4.52 | -5.25 | -3.92 | -4.64 | -4.64 | -4.64 | -4.64 | -4.64 |
| Tax Rate, % | 34.38 | 34.38 | 34.38 | 34.38 | 34.38 | 34.38 | 34.38 | 34.38 | 34.38 | 34.38 |
| EBITAT | 25,766.6 | 51,152.1 | 86,193.0 | 111,621.7 | 99,243.6 | 77,779.7 | 79,505.2 | 81,269.0 | 83,071.9 | 84,914.8 |
| Depreciation | ||||||||||
| Changes in Account Receivables | ||||||||||
| Changes in Inventories | ||||||||||
| Changes in Accounts Payable | ||||||||||
| Capital Expenditure | ||||||||||
| UFCF | -208,403.4 | 31,023.1 | 51,117.0 | 59,830.7 | 94,200.6 | 80,855.6 | 61,252.9 | 62,611.8 | 64,000.8 | 65,420.6 |
| WACC, % | 4.49 | 4.59 | 4.56 | 4.59 | 4.54 | 4.55 | 4.55 | 4.55 | 4.55 | 4.55 |
| PV UFCF | ||||||||||
| SUM PV UFCF | 294,067.5 | |||||||||
| Long Term Growth Rate, % | 2.00 | |||||||||
| Free cash flow (T + 1) | 66,729 | |||||||||
| Terminal Value | 2,612,693 | |||||||||
| Present Terminal Value | 2,091,147 | |||||||||
| Enterprise Value | 2,385,214 | |||||||||
| Net Debt | -92,988 | |||||||||
| Equity Value | 2,478,202 | |||||||||
| Diluted Shares Outstanding, MM | 463 | |||||||||
| Equity Value Per Share | 5,349.11 |
Benefits of Using Our Template
- Flexible Input Options: Modify key assumptions (growth %, margins, WACC) effortlessly to explore various scenarios.
- Accurate Financial Data: Pre-loaded financial information for Dai Nippon Printing Co., Ltd. (7912T) to enhance your analysis.
- Instant DCF Calculations: Automatically compute Net Present Value (NPV) and intrinsic value with the built-in formulas.
- Professional and Adaptable: A sleek Excel model tailored to meet your valuation requirements.
- Designed for Analysts and Investors: Perfect for validating assumptions, assessing strategies, and streamlining your workflow.
Key Features
- Pre-Loaded Data: Dai Nippon Printing’s historical financial statements and pre-filled forecasts.
- Fully Adjustable Inputs: Customize WACC, tax rates, revenue growth, and EBITDA margins.
- Instant Results: Witness Dai Nippon Printing’s intrinsic value update in real time.
- Clear Visual Outputs: Dashboard charts showcase valuation results and essential metrics.
- Built for Accuracy: A reliable tool designed for analysts, investors, and finance professionals.
How It Works
- Step 1: Download the Excel spreadsheet.
- Step 2: Examine the pre-filled data for Dai Nippon Printing Co., Ltd. (7912T) (historical and projected).
- Step 3: Modify key assumptions (highlighted in yellow) according to your analysis.
- Step 4: Observe the automatic recalculations of Dai Nippon Printing's intrinsic value.
- Step 5: Utilize the results for making investment decisions or for reporting purposes.
Why Opt for This Calculator?
- Reliable Data: Utilize authentic Dai Nippon Printing Co., Ltd. (7912T) financials for trustworthy valuation results.
- Customizable Options: Tailor critical parameters such as growth rates, WACC, and tax rates to align with your forecasts.
- Efficiency Boost: Pre-configured calculations save you from starting from the ground up.
- Professional-Quality Tool: Crafted for investors, analysts, and consultants in the field.
- User-Friendly Design: An intuitive interface and detailed instructions ensure accessibility for all users.
Who Can Benefit from Dai Nippon Printing Co., Ltd. (7912T)?
- Investors: Gain insights and make informed decisions with our advanced valuation resources.
- Financial Analysts: Streamline your workflow with a customizable DCF model tailored to your needs.
- Consultants: Efficiently modify the template for impactful client presentations or comprehensive reports.
- Finance Enthusiasts: Enhance your knowledge of valuation methods through practical, real-world applications.
- Educators and Students: Utilize it as a hands-on educational tool in finance and investment courses.
Contents of the Template
- Preloaded DNP Data: Historical and projected financial information, including revenue, EBIT, and capital expenditures.
- DCF and WACC Models: Advanced spreadsheets for determining intrinsic value and the Weighted Average Cost of Capital.
- Editable Inputs: Yellow-highlighted fields for modifying revenue growth, tax rates, and discount rates.
- Financial Statements: Detailed annual and quarterly financial reports for in-depth analysis.
- Key Ratios: Metrics for profitability, leverage, and efficiency to assess performance.
- Dashboard and Charts: Visual representations of valuation results and underlying assumptions.
Disclaimer
All information, articles, and product details provided on this website are for general informational and educational purposes only. We do not claim any ownership over, nor do we intend to infringe upon, any trademarks, copyrights, logos, brand names, or other intellectual property mentioned or depicted on this site. Such intellectual property remains the property of its respective owners, and any references here are made solely for identification or informational purposes, without implying any affiliation, endorsement, or partnership.
We make no representations or warranties, express or implied, regarding the accuracy, completeness, or suitability of any content or products presented. Nothing on this website should be construed as legal, tax, investment, financial, medical, or other professional advice. In addition, no part of this site—including articles or product references—constitutes a solicitation, recommendation, endorsement, advertisement, or offer to buy or sell any securities, franchises, or other financial instruments, particularly in jurisdictions where such activity would be unlawful.
All content is of a general nature and may not address the specific circumstances of any individual or entity. It is not a substitute for professional advice or services. Any actions you take based on the information provided here are strictly at your own risk. You accept full responsibility for any decisions or outcomes arising from your use of this website and agree to release us from any liability in connection with your use of, or reliance upon, the content or products found herein.