
|
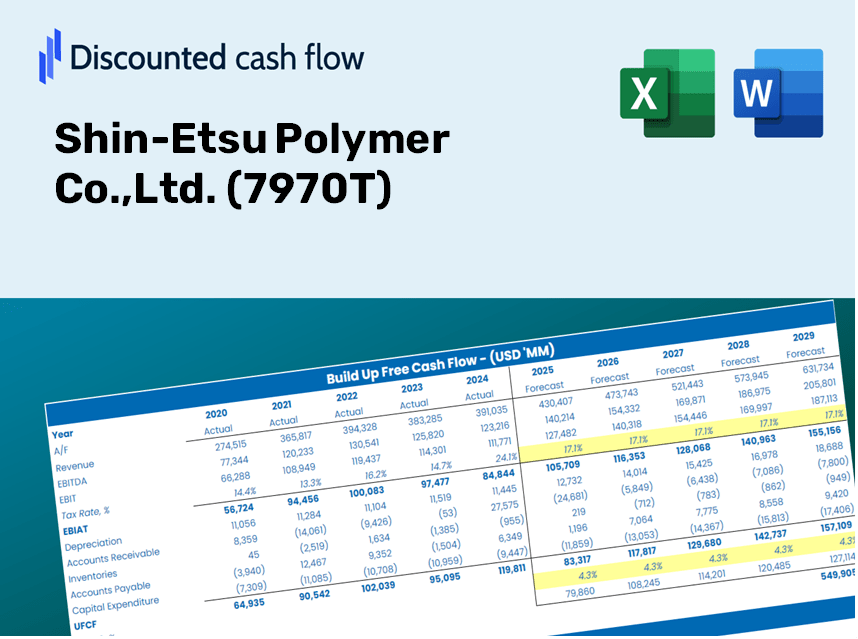
Shin-emsu Polymer Co., Ltd. (7970.t) DCF -Bewertung |
Fully Editable: Tailor To Your Needs In Excel Or Sheets
Professional Design: Trusted, Industry-Standard Templates
Investor-Approved Valuation Models
MAC/PC Compatible, Fully Unlocked
No Expertise Is Needed; Easy To Follow
Shin-Etsu Polymer Co.,Ltd. (7970.T) Bundle
Möchten Sie den inneren Wert von Shin-Etsu Polymer Co., Ltd., bestimmen? Unser (7970T) DCF-Taschenrechner integriert reale Daten mit umfangreichen Anpassungsfunktionen, sodass Sie Prognosen anpassen und Ihre Anlagestrategien verbessern können.
Discounted Cash Flow (DCF) - (USD MM)
| Year | AY1 2020 |
AY2 2021 |
AY3 2022 |
AY4 2023 |
AY5 2024 |
FY1 2025 |
FY2 2026 |
FY3 2027 |
FY4 2028 |
FY5 2029 |
|---|---|---|---|---|---|---|---|---|---|---|
| Revenue | 76,904.0 | 92,640.0 | 108,278.0 | 104,379.0 | 110,582.0 | 121,552.9 | 133,612.2 | 146,867.9 | 161,438.7 | 177,455.1 |
| Revenue Growth, % | 0 | 20.46 | 16.88 | -3.6 | 5.94 | 9.92 | 9.92 | 9.92 | 9.92 | 9.92 |
| EBITDA | 9,940.0 | 13,228.0 | 15,548.0 | 15,715.0 | 19,032.0 | 17,948.5 | 19,729.2 | 21,686.5 | 23,838.0 | 26,203.0 |
| EBITDA, % | 12.93 | 14.28 | 14.36 | 15.06 | 17.21 | 14.77 | 14.77 | 14.77 | 14.77 | 14.77 |
| Depreciation | 3,511.0 | 3,790.0 | 4,141.0 | 4,663.0 | 5,789.0 | 5,392.9 | 5,927.9 | 6,516.0 | 7,162.5 | 7,873.1 |
| Depreciation, % | 4.57 | 4.09 | 3.82 | 4.47 | 5.24 | 4.44 | 4.44 | 4.44 | 4.44 | 4.44 |
| EBIT | 6,429.0 | 9,438.0 | 11,407.0 | 11,052.0 | 13,243.0 | 12,555.6 | 13,801.2 | 15,170.4 | 16,675.5 | 18,329.9 |
| EBIT, % | 8.36 | 10.19 | 10.53 | 10.59 | 11.98 | 10.33 | 10.33 | 10.33 | 10.33 | 10.33 |
| Total Cash | 47,620.0 | 48,749.0 | 46,900.0 | 42,453.0 | 44,901.0 | 58,134.8 | 63,902.4 | 70,242.2 | 77,211.0 | 84,871.1 |
| Total Cash, percent | .0 | .0 | .0 | .0 | .0 | .0 | .0 | .0 | .0 | .0 |
| Account Receivables | 23,153.0 | 26,714.0 | 30,617.0 | 28,749.0 | 31,986.0 | 34,931.1 | 38,396.7 | 42,206.0 | 46,393.3 | 50,996.0 |
| Account Receivables, % | 30.11 | 28.84 | 28.28 | 27.54 | 28.93 | 28.74 | 28.74 | 28.74 | 28.74 | 28.74 |
| Inventories | 10,875.0 | 14,897.0 | 19,630.0 | 20,212.0 | 21,927.0 | 21,282.3 | 23,393.8 | 25,714.7 | 28,265.8 | 31,070.1 |
| Inventories, % | 14.14 | 16.08 | 18.13 | 19.36 | 19.83 | 17.51 | 17.51 | 17.51 | 17.51 | 17.51 |
| Accounts Payable | 10,171.0 | 12,817.0 | 15,065.0 | 13,333.0 | 16,198.0 | 16,627.4 | 18,277.0 | 20,090.3 | 22,083.4 | 24,274.3 |
| Accounts Payable, % | 13.23 | 13.84 | 13.91 | 12.77 | 14.65 | 13.68 | 13.68 | 13.68 | 13.68 | 13.68 |
| Capital Expenditure | -2,785.0 | -4,572.0 | -10,937.0 | -14,935.0 | -10,679.0 | -10,361.9 | -11,389.9 | -12,519.9 | -13,762.0 | -15,127.3 |
| Capital Expenditure, % | -3.62 | -4.94 | -10.1 | -14.31 | -9.66 | -8.52 | -8.52 | -8.52 | -8.52 | -8.52 |
| Tax Rate, % | 28.6 | 28.6 | 28.6 | 28.6 | 28.6 | 28.6 | 28.6 | 28.6 | 28.6 | 28.6 |
| EBITAT | 4,555.1 | 6,324.8 | 8,554.5 | 8,139.3 | 9,455.7 | 8,987.5 | 9,879.1 | 10,859.2 | 11,936.6 | 13,120.8 |
| Depreciation | ||||||||||
| Changes in Account Receivables | ||||||||||
| Changes in Inventories | ||||||||||
| Changes in Accounts Payable | ||||||||||
| Capital Expenditure | ||||||||||
| UFCF | -18,575.9 | 605.8 | -4,629.5 | -2,578.7 | 2,478.7 | 2,147.4 | 489.8 | 538.4 | 591.8 | 650.5 |
| WACC, % | 5.89 | 5.89 | 5.89 | 5.89 | 5.89 | 5.89 | 5.89 | 5.89 | 5.89 | 5.89 |
| PV UFCF | ||||||||||
| SUM PV UFCF | 3,877.6 | |||||||||
| Long Term Growth Rate, % | 1.00 | |||||||||
| Free cash flow (T + 1) | 657 | |||||||||
| Terminal Value | 13,438 | |||||||||
| Present Terminal Value | 10,095 | |||||||||
| Enterprise Value | 13,972 | |||||||||
| Net Debt | -44,901 | |||||||||
| Equity Value | 58,873 | |||||||||
| Diluted Shares Outstanding, MM | 81 | |||||||||
| Equity Value Per Share | 726.52 |
What You Will Receive
- Comprehensive 7970T Financial Data: Access to both historical and projected figures for precise valuation.
- Customizable Parameters: Adjust WACC, tax rates, revenue growth, and capital spending as needed.
- Automated Calculations: Dynamic computation of intrinsic value and NPV.
- Scenario Evaluation: Analyze various scenarios to assess the future performance of Shin-Etsu Polymer Co., Ltd.
- User-Friendly Interface: Designed for industry professionals while remaining approachable for newcomers.
Key Features
- Pre-Loaded Data: Shin-Etsu Polymer Co., Ltd.'s historical financial statements and pre-filled forecasts.
- Fully Adjustable Inputs: Customize WACC, tax rates, revenue growth, and EBITDA margins to fit your analysis.
- Instant Results: View the intrinsic value of Shin-Etsu Polymer Co., Ltd. (7970T) recalculated in real time.
- Clear Visual Outputs: Intuitive dashboard charts present valuation results and key financial metrics.
- Built for Accuracy: A professional-grade tool designed for analysts, investors, and finance professionals.
How It Operates
- Step 1: Download the Excel file.
- Step 2: Review Shin-Etsu Polymer Co., Ltd.'s pre-filled financial data and projections.
- Step 3: Adjust key inputs such as revenue growth, WACC, and tax rates (highlighted cells).
- Step 4: Observe the DCF model update in real-time as you modify your assumptions.
- Step 5: Evaluate the outputs and leverage the results for your investment strategies.
Why Choose This Calculator for Shin-Etsu Polymer Co.,Ltd. (7970T)?
- Precise Information: Access real financial data for Shin-Etsu Polymer to ensure dependable valuation outcomes.
- Tailorable: Modify essential parameters such as growth rates, WACC, and tax rates to align with your financial forecasts.
- Efficient: Pre-configured calculations save you time by eliminating the need for a fresh start.
- Professional Quality: Built for investors, analysts, and consultants who require accuracy.
- Easy to Navigate: User-friendly design and clear step-by-step guidance make it accessible for everyone.
Who Can Benefit from This Product?
- Investors: Evaluate the intrinsic value of Shin-Etsu Polymer Co., Ltd. (7970T) to inform your investment choices.
- Chief Financial Officers (CFOs): Utilize a robust DCF model for accurate financial reporting and comprehensive analysis.
- Consultants: Easily customize the template for client valuation reports tailored to Shin-Etsu Polymer Co., Ltd. (7970T).
- Entrepreneurs: Unlock valuable insights into the financial modeling practices adopted by leading companies.
- Educators: Employ this resource as a practical tool to teach valuation techniques effectively.
What the Template Contains
- Historical Data: Provides insights into Shin-Etsu Polymer Co., Ltd.'s (7970T) past financial performance and foundational forecasts.
- DCF and Levered DCF Models: Comprehensive templates designed to assess the intrinsic value of Shin-Etsu Polymer Co., Ltd. (7970T).
- WACC Sheet: Pre-constructed calculations for the Weighted Average Cost of Capital.
- Editable Inputs: Customize essential factors such as growth rates, EBITDA percentages, and capital expenditure assumptions.
- Quarterly and Annual Statements: A thorough analysis of Shin-Etsu Polymer Co., Ltd.'s (7970T) financial data.
- Interactive Dashboard: Explore valuation outcomes and forecasts in an engaging visual format.
Disclaimer
All information, articles, and product details provided on this website are for general informational and educational purposes only. We do not claim any ownership over, nor do we intend to infringe upon, any trademarks, copyrights, logos, brand names, or other intellectual property mentioned or depicted on this site. Such intellectual property remains the property of its respective owners, and any references here are made solely for identification or informational purposes, without implying any affiliation, endorsement, or partnership.
We make no representations or warranties, express or implied, regarding the accuracy, completeness, or suitability of any content or products presented. Nothing on this website should be construed as legal, tax, investment, financial, medical, or other professional advice. In addition, no part of this site—including articles or product references—constitutes a solicitation, recommendation, endorsement, advertisement, or offer to buy or sell any securities, franchises, or other financial instruments, particularly in jurisdictions where such activity would be unlawful.
All content is of a general nature and may not address the specific circumstances of any individual or entity. It is not a substitute for professional advice or services. Any actions you take based on the information provided here are strictly at your own risk. You accept full responsibility for any decisions or outcomes arising from your use of this website and agree to release us from any liability in connection with your use of, or reliance upon, the content or products found herein.