
|
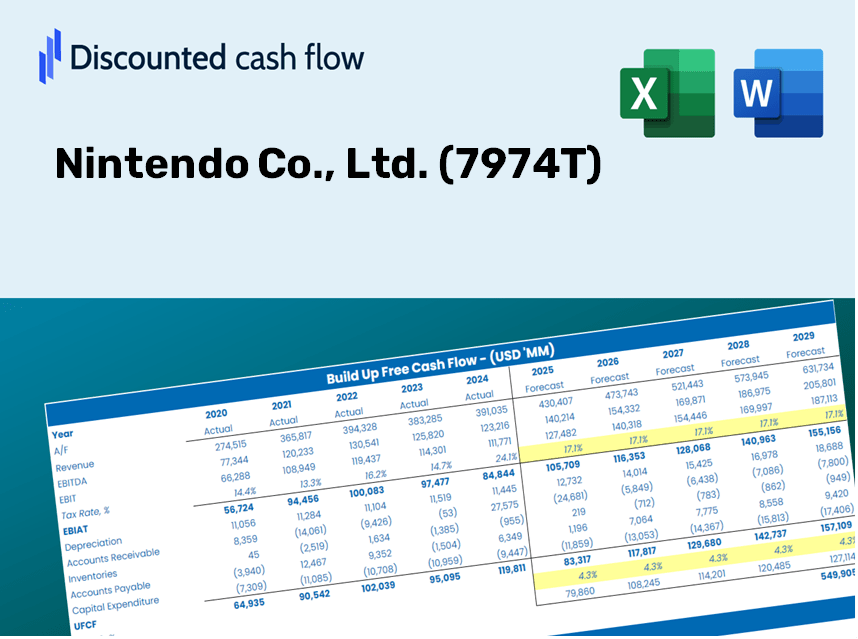
Nintendo Co., Ltd. (7974.t) DCF -Bewertung |
Fully Editable: Tailor To Your Needs In Excel Or Sheets
Professional Design: Trusted, Industry-Standard Templates
Investor-Approved Valuation Models
MAC/PC Compatible, Fully Unlocked
No Expertise Is Needed; Easy To Follow
Nintendo Co., Ltd. (7974.T) Bundle
Möchten Sie den inneren Wert von Nintendo Co., Ltd. bewerten? Unser (7974T) DCF-Taschenrechner integriert reale Daten mit umfangreichen Anpassungsfunktionen, sodass Sie Ihre Prognosen verfeinern und Ihre Anlagestrategien verbessern können.
Discounted Cash Flow (DCF) - (USD MM)
| Year | AY1 2021 |
AY2 2022 |
AY3 2023 |
AY4 2024 |
AY5 2025 |
FY1 2026 |
FY2 2027 |
FY3 2028 |
FY4 2029 |
FY5 2030 |
|---|---|---|---|---|---|---|---|---|---|---|
| Revenue | 1,758,910.0 | 1,695,344.0 | 1,601,677.0 | 1,671,865.0 | 1,164,922.0 | 1,062,762.0 | 969,561.1 | 884,533.6 | 806,962.8 | 736,194.7 |
| Revenue Growth, % | 0 | -3.61 | -5.52 | 4.38 | -30.32 | -8.77 | -8.77 | -8.77 | -8.77 | -8.77 |
| EBITDA | 651,433.0 | 603,289.0 | 611,919.0 | 698,745.0 | 387,693.0 | 395,137.2 | 360,484.9 | 328,871.5 | 300,030.5 | 273,718.7 |
| EBITDA, % | 37.04 | 35.59 | 38.2 | 41.79 | 33.28 | 37.18 | 37.18 | 37.18 | 37.18 | 37.18 |
| Depreciation | 10,798.0 | 10,527.0 | 11,040.0 | 17,856.0 | 15,361.0 | 9,162.7 | 8,359.1 | 7,626.0 | 6,957.3 | 6,347.1 |
| Depreciation, % | 0.6139 | 0.62094 | 0.68928 | 1.07 | 1.32 | 0.86215 | 0.86215 | 0.86215 | 0.86215 | 0.86215 |
| EBIT | 640,635.0 | 592,762.0 | 600,879.0 | 680,889.0 | 372,332.0 | 385,974.5 | 352,125.8 | 321,245.4 | 293,073.2 | 267,371.6 |
| EBIT, % | 36.42 | 34.96 | 37.52 | 40.73 | 31.96 | 36.32 | 36.32 | 36.32 | 36.32 | 36.32 |
| Total Cash | 1,742,389.0 | 1,710,891.0 | 1,879,365.0 | 2,252,705.0 | 2,058,190.0 | 1,060,765.5 | 967,739.7 | 882,872.0 | 805,446.9 | 734,811.7 |
| Total Cash, percent | .0 | .0 | .0 | .0 | .0 | .0 | .0 | .0 | .0 | .0 |
| Account Receivables | 140,476.0 | 140,989.0 | 119,696.0 | 93,517.0 | 65,128.0 | 74,308.9 | 67,792.3 | 61,847.1 | 56,423.3 | 51,475.2 |
| Account Receivables, % | 7.99 | 8.32 | 7.47 | 5.59 | 5.59 | 6.99 | 6.99 | 6.99 | 6.99 | 6.99 |
| Inventories | 86,817.0 | 204,183.0 | 258,628.0 | 155,987.0 | 486,428.0 | 178,997.4 | 163,299.9 | 148,979.0 | 135,914.0 | 123,994.8 |
| Inventories, % | 4.94 | 12.04 | 16.15 | 9.33 | 41.76 | 16.84 | 16.84 | 16.84 | 16.84 | 16.84 |
| Accounts Payable | 114,677.0 | 150,910.0 | 149,217.0 | 58,084.0 | 201,091.0 | 96,655.9 | 88,179.5 | 80,446.4 | 73,391.5 | 66,955.3 |
| Accounts Payable, % | 6.52 | 8.9 | 9.32 | 3.47 | 17.26 | 9.09 | 9.09 | 9.09 | 9.09 | 9.09 |
| Capital Expenditure | -7,011.0 | -7,587.0 | -22,190.0 | -16,123.0 | -19,008.0 | -10,261.2 | -9,361.3 | -8,540.4 | -7,791.4 | -7,108.1 |
| Capital Expenditure, % | -0.3986 | -0.44752 | -1.39 | -0.96437 | -1.63 | -0.96552 | -0.96552 | -0.96552 | -0.96552 | -0.96552 |
| Tax Rate, % | 25.12 | 25.12 | 25.12 | 25.12 | 25.12 | 25.12 | 25.12 | 25.12 | 25.12 | 25.12 |
| EBITAT | 451,700.3 | 419,872.0 | 432,855.9 | 490,722.4 | 278,806.7 | 278,156.8 | 253,763.3 | 231,509.1 | 211,206.5 | 192,684.3 |
| Depreciation | ||||||||||
| Changes in Account Receivables | ||||||||||
| Changes in Inventories | ||||||||||
| Changes in Accounts Payable | ||||||||||
| Capital Expenditure | ||||||||||
| UFCF | 342,871.3 | 341,166.0 | 386,860.9 | 530,142.4 | 116,114.7 | 470,872.8 | 266,498.9 | 243,127.8 | 221,806.2 | 202,354.5 |
| WACC, % | 5.48 | 5.48 | 5.48 | 5.48 | 5.48 | 5.48 | 5.48 | 5.48 | 5.48 | 5.48 |
| PV UFCF | ||||||||||
| SUM PV UFCF | 1,227,250.7 | |||||||||
| Long Term Growth Rate, % | 2.00 | |||||||||
| Free cash flow (T + 1) | 206,402 | |||||||||
| Terminal Value | 5,930,390 | |||||||||
| Present Terminal Value | 4,541,761 | |||||||||
| Enterprise Value | 5,769,012 | |||||||||
| Net Debt | -1,586,275 | |||||||||
| Equity Value | 7,355,287 | |||||||||
| Diluted Shares Outstanding, MM | 1,164 | |||||||||
| Equity Value Per Share | 6,317.65 |
What You Will Receive
- Customizable Excel Template: A fully adjustable Excel-based DCF Calculator featuring pre-filled real Nintendo (7974T) financials.
- Accurate Data: Historical performance data and forward-looking projections (highlighted in the yellow cells).
- Flexible Forecasting: Modify forecast variables such as revenue growth, EBITDA margin, and WACC.
- Instant Calculations: Rapidly observe the effects of your inputs on Nintendo's valuation.
- Professional-Grade Tool: Designed for investors, CFOs, consultants, and financial analysts.
- User-Friendly Interface: Organized for clarity and efficiency, complete with step-by-step guidance.
Key Features
- Genuine Nintendo Financials: Access comprehensive pre-loaded historical data and future forecasts.
- Personalized Forecast Assumptions: Modify yellow-highlighted fields such as WACC, growth rates, and profit margins.
- Real-Time Calculations: Instant updates for DCF, Net Present Value (NPV), and cash flow assessments.
- Interactive Dashboard: User-friendly charts and summaries to visualize your valuation outcomes.
- Ideal for All Users: A straightforward, intuitive layout designed for investors, CFOs, and consultants alike.
How It Works
- Step 1: Download the prebuilt Excel template featuring Nintendo Co., Ltd.'s data included.
- Step 2: Review the pre-filled sheets to familiarize yourself with the essential metrics.
- Step 3: Update forecasts and assumptions in the editable yellow cells (WACC, growth, margins).
- Step 4: Instantly view recalculated results, including Nintendo Co., Ltd.'s intrinsic value.
- Step 5: Make informed investment decisions or create reports using the generated outputs.
Why Opt for This Nintendo Calculator?
- Reliable Data: Authentic financials from Nintendo ensure trustworthy valuation outcomes.
- Tailorable: Modify essential factors such as growth projections, WACC, and tax rates to suit your estimates.
- Efficiency: Pre-configured calculations save you the hassle of starting from square one.
- Professional Quality: Created for investors, analysts, and consultants working with Nintendo (7974T).
- Easy to Use: User-friendly design and step-by-step guidance make it accessible for everyone.
Who Can Benefit from This Product?
- Investors: Evaluate Nintendo's valuation before making stock transactions.
- CFOs and Financial Analysts: Optimize valuation workflows and assess financial forecasts.
- Startup Founders: Gain insights into the valuation methods used by established companies like Nintendo.
- Consultants: Provide comprehensive valuation analysis and reports for clients.
- Students and Educators: Utilize real-time data to learn and teach valuation methodologies.
Contents of the Template
- Pre-Filled Data: Contains Nintendo’s historical financial information and future projections.
- Discounted Cash Flow Model: An editable DCF valuation model featuring automatic calculations.
- Weighted Average Cost of Capital (WACC): A dedicated worksheet for calculating WACC using customized inputs.
- Key Financial Ratios: Assess Nintendo’s profitability, efficiency, and leverage metrics.
- Customizable Inputs: Easily modify revenue growth rates, profit margins, and tax percentages.
- Comprehensive Dashboard: Visual representations and tables summarizing essential valuation outcomes.
Disclaimer
All information, articles, and product details provided on this website are for general informational and educational purposes only. We do not claim any ownership over, nor do we intend to infringe upon, any trademarks, copyrights, logos, brand names, or other intellectual property mentioned or depicted on this site. Such intellectual property remains the property of its respective owners, and any references here are made solely for identification or informational purposes, without implying any affiliation, endorsement, or partnership.
We make no representations or warranties, express or implied, regarding the accuracy, completeness, or suitability of any content or products presented. Nothing on this website should be construed as legal, tax, investment, financial, medical, or other professional advice. In addition, no part of this site—including articles or product references—constitutes a solicitation, recommendation, endorsement, advertisement, or offer to buy or sell any securities, franchises, or other financial instruments, particularly in jurisdictions where such activity would be unlawful.
All content is of a general nature and may not address the specific circumstances of any individual or entity. It is not a substitute for professional advice or services. Any actions you take based on the information provided here are strictly at your own risk. You accept full responsibility for any decisions or outcomes arising from your use of this website and agree to release us from any liability in connection with your use of, or reliance upon, the content or products found herein.