
|
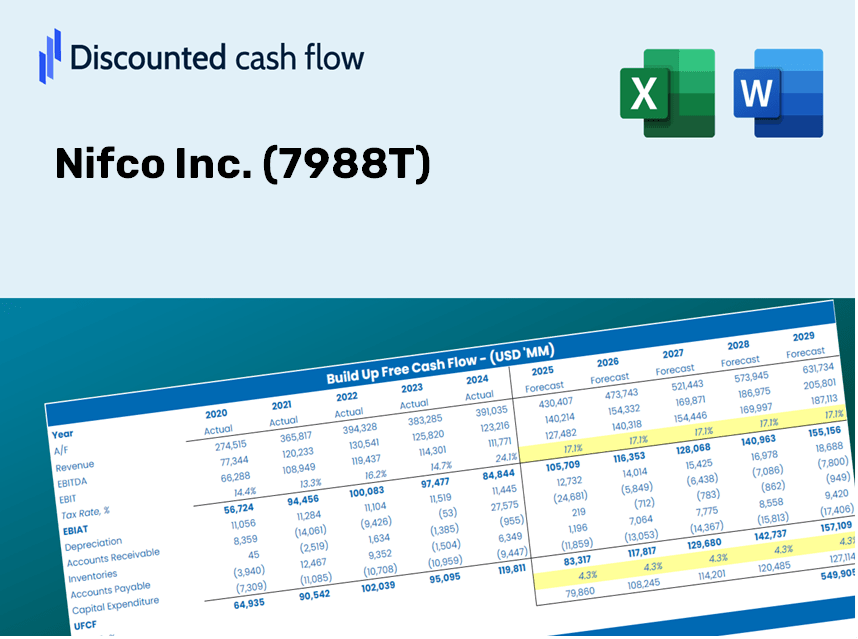
NIFCO Inc. (7988.t) DCF -Bewertung |
Fully Editable: Tailor To Your Needs In Excel Or Sheets
Professional Design: Trusted, Industry-Standard Templates
Investor-Approved Valuation Models
MAC/PC Compatible, Fully Unlocked
No Expertise Is Needed; Easy To Follow
Nifco Inc. (7988.T) Bundle
Gewinnen Sie die Bewertungsanalyse für Ihre NIFCO Inc. (7988T) mit unserem ausgeklügelten DCF -Taschenrechner! Mit dieser Excel-Vorlage können Sie mit Echtzeitdaten für (7988T) die Prognosen und Annahmen anpassen, sodass Sie den intrinsischen Wert von NIFCO Inc. mit Genauigkeit bestimmen können.
Discounted Cash Flow (DCF) - (USD MM)
| Year | AY1 2021 |
AY2 2022 |
AY3 2023 |
AY4 2024 |
AY5 2025 |
FY1 2026 |
FY2 2027 |
FY3 2028 |
FY4 2029 |
FY5 2030 |
|---|---|---|---|---|---|---|---|---|---|---|
| Revenue | 256,078.0 | 283,777.0 | 321,771.0 | 371,639.0 | 353,038.0 | 383,662.4 | 416,943.4 | 453,111.3 | 492,416.6 | 535,131.5 |
| Revenue Growth, % | 0 | 10.82 | 13.39 | 15.5 | -5.01 | 8.67 | 8.67 | 8.67 | 8.67 | 8.67 |
| EBITDA | 41,578.0 | 43,688.0 | 50,267.0 | 46,306.0 | 67,592.0 | 60,510.8 | 65,759.8 | 71,464.2 | 77,663.3 | 84,400.3 |
| EBITDA, % | 16.24 | 15.4 | 15.62 | 12.46 | 19.15 | 15.77 | 15.77 | 15.77 | 15.77 | 15.77 |
| Depreciation | 13,882.0 | 13,147.0 | 14,090.0 | 14,610.0 | 13,007.0 | 16,918.2 | 18,385.8 | 19,980.7 | 21,713.9 | 23,597.5 |
| Depreciation, % | 5.42 | 4.63 | 4.38 | 3.93 | 3.68 | 4.41 | 4.41 | 4.41 | 4.41 | 4.41 |
| EBIT | 27,696.0 | 30,541.0 | 36,177.0 | 31,696.0 | 54,585.0 | 43,592.6 | 47,374.0 | 51,483.5 | 55,949.4 | 60,802.8 |
| EBIT, % | 10.82 | 10.76 | 11.24 | 8.53 | 15.46 | 11.36 | 11.36 | 11.36 | 11.36 | 11.36 |
| Total Cash | 97,601.0 | 113,701.0 | 130,484.0 | 150,928.0 | 147,581.0 | 154,345.3 | 167,734.0 | 182,284.2 | 198,096.5 | 215,280.4 |
| Total Cash, percent | .0 | .0 | .0 | .0 | .0 | .0 | .0 | .0 | .0 | .0 |
| Account Receivables | 54,404.0 | 47,721.0 | 51,508.0 | 60,331.0 | 60,348.0 | 67,061.7 | 72,879.0 | 79,201.0 | 86,071.3 | 93,537.6 |
| Account Receivables, % | 21.25 | 16.82 | 16.01 | 16.23 | 17.09 | 17.48 | 17.48 | 17.48 | 17.48 | 17.48 |
| Inventories | 29,091.0 | 39,348.0 | 41,212.0 | 40,876.0 | 39,226.0 | 46,149.8 | 50,153.1 | 54,503.6 | 59,231.5 | 64,369.6 |
| Inventories, % | 11.36 | 13.87 | 12.81 | 11 | 11.11 | 12.03 | 12.03 | 12.03 | 12.03 | 12.03 |
| Accounts Payable | 20,912.0 | 22,258.0 | 25,076.0 | 26,601.0 | 26,284.0 | 29,469.7 | 32,026.0 | 34,804.1 | 37,823.2 | 41,104.2 |
| Accounts Payable, % | 8.17 | 7.84 | 7.79 | 7.16 | 7.45 | 7.68 | 7.68 | 7.68 | 7.68 | 7.68 |
| Capital Expenditure | -15,093.0 | -9,614.0 | -8,607.0 | -8,799.0 | -18,185.0 | -14,943.9 | -16,240.2 | -17,648.9 | -19,179.9 | -20,843.7 |
| Capital Expenditure, % | -5.89 | -3.39 | -2.67 | -2.37 | -5.15 | -3.9 | -3.9 | -3.9 | -3.9 | -3.9 |
| Tax Rate, % | 17.59 | 17.59 | 17.59 | 17.59 | 17.59 | 17.59 | 17.59 | 17.59 | 17.59 | 17.59 |
| EBITAT | 18,790.8 | 21,060.6 | 21,478.7 | 18,676.8 | 44,983.1 | 29,425.9 | 31,978.4 | 34,752.4 | 37,767.0 | 41,043.1 |
| Depreciation | ||||||||||
| Changes in Account Receivables | ||||||||||
| Changes in Inventories | ||||||||||
| Changes in Accounts Payable | ||||||||||
| Capital Expenditure | ||||||||||
| UFCF | -45,003.2 | 22,365.6 | 24,128.7 | 17,525.8 | 41,121.1 | 20,948.4 | 26,859.8 | 29,189.8 | 31,721.9 | 34,473.6 |
| WACC, % | 9.57 | 9.57 | 9.55 | 9.54 | 9.61 | 9.57 | 9.57 | 9.57 | 9.57 | 9.57 |
| PV UFCF | ||||||||||
| SUM PV UFCF | 107,523.5 | |||||||||
| Long Term Growth Rate, % | 2.00 | |||||||||
| Free cash flow (T + 1) | 35,163 | |||||||||
| Terminal Value | 464,604 | |||||||||
| Present Terminal Value | 294,209 | |||||||||
| Enterprise Value | 401,733 | |||||||||
| Net Debt | -105,612 | |||||||||
| Equity Value | 507,345 | |||||||||
| Diluted Shares Outstanding, MM | 97 | |||||||||
| Equity Value Per Share | 5,235.21 |
What You Will Receive
- Customizable Excel Template: A fully adaptable Excel-based DCF Calculator featuring pre-filled financial data for Nifco Inc. (7988T).
- Actual Financial Data: Access to historical performance metrics and future projections (highlighted in the yellow cells).
- Flexible Forecasting: Adjust forecast parameters such as revenue growth, EBITDA %, and WACC to suit your analysis.
- Real-Time Calculations: Instantly observe how your inputs affect the valuation of Nifco Inc. (7988T).
- Professional-Grade Tool: Designed for investors, CFOs, consultants, and financial analysts.
- Intuitive Design: Organized for clarity and simplicity, accompanied by step-by-step guidance.
Key Features of Nifco Inc. (7988T)
- Authentic Financial Data: Gain access to reliable pre-loaded historical figures and future forecasts.
- Flexible Forecast Parameters: Modify the highlighted cells for WACC, growth rates, and profit margins.
- Real-Time Calculations: DCF, Net Present Value (NPV), and cash flow analysis are updated automatically.
- User-Friendly Dashboard: Intuitive charts and summaries for easy visualization of your valuation insights.
- Designed for All Skill Levels: A straightforward, accessible format ideal for investors, CFOs, and consultants alike.
How It Functions
- Download the Template: Gain immediate access to the Excel-based Nifco Inc. (7988T) DCF Calculator.
- Input Your Assumptions: Modify the yellow-highlighted cells to set your growth rates, WACC, margins, and other parameters.
- Instant Calculations: The model will automatically refresh to show Nifco Inc.'s (7988T) intrinsic value.
- Test Scenarios: Experiment with various assumptions to assess potential changes in valuation.
- Analyze and Decide: Utilize the findings to inform your investment or financial decisions.
Why Select This Calculator for Nifco Inc. (7988T)?
- Reliable Data: Access accurate financials for Nifco Inc. (7988T) to produce trustworthy valuation outcomes.
- Tailored Experience: Modify essential factors such as growth rates, WACC, and tax rates to align with your forecasts.
- Efficient: Built-in calculations save you time and effort, allowing you to focus on analysis.
- Professional Quality: Crafted for investors, analysts, and consultants seeking precision with Nifco Inc. (7988T).
- Easy to Use: Designed with an intuitive interface and clear instructions to cater to all users.
Who is This Product Ideal For?
- Finance Students: Master valuation techniques while utilizing real-time data applicable to Nifco Inc. (7988T).
- Academics: Integrate professional models into your lectures or research related to Nifco Inc. (7988T).
- Investors: Evaluate your own assumptions and assess valuation scenarios for Nifco Inc. (7988T).
- Analysts: Enhance your efficiency with a tailored, ready-to-use DCF model focused on Nifco Inc. (7988T).
- Small Business Owners: Discover how large public companies like Nifco Inc. (7988T) are evaluated in the market.
Components of the Template
- Pre-Filled DCF Model: Nifco Inc.'s financial data preloaded for immediate analysis.
- WACC Calculator: Comprehensive calculations for Weighted Average Cost of Capital.
- Financial Ratios: Assess Nifco Inc.'s profitability, leverage, and operational efficiency.
- Editable Inputs: Adjust assumptions like growth rates, margins, and CAPEX to align with your scenarios.
- Financial Statements: Annual and quarterly reports available for in-depth examination.
- Interactive Dashboard: Effortlessly visualize key valuation metrics and outcomes.
Disclaimer
All information, articles, and product details provided on this website are for general informational and educational purposes only. We do not claim any ownership over, nor do we intend to infringe upon, any trademarks, copyrights, logos, brand names, or other intellectual property mentioned or depicted on this site. Such intellectual property remains the property of its respective owners, and any references here are made solely for identification or informational purposes, without implying any affiliation, endorsement, or partnership.
We make no representations or warranties, express or implied, regarding the accuracy, completeness, or suitability of any content or products presented. Nothing on this website should be construed as legal, tax, investment, financial, medical, or other professional advice. In addition, no part of this site—including articles or product references—constitutes a solicitation, recommendation, endorsement, advertisement, or offer to buy or sell any securities, franchises, or other financial instruments, particularly in jurisdictions where such activity would be unlawful.
All content is of a general nature and may not address the specific circumstances of any individual or entity. It is not a substitute for professional advice or services. Any actions you take based on the information provided here are strictly at your own risk. You accept full responsibility for any decisions or outcomes arising from your use of this website and agree to release us from any liability in connection with your use of, or reliance upon, the content or products found herein.