
|
Okamura Corporation (7994.t) DCF -Bewertung |
Fully Editable: Tailor To Your Needs In Excel Or Sheets
Professional Design: Trusted, Industry-Standard Templates
Investor-Approved Valuation Models
MAC/PC Compatible, Fully Unlocked
No Expertise Is Needed; Easy To Follow
Okamura Corporation (7994.T) Bundle
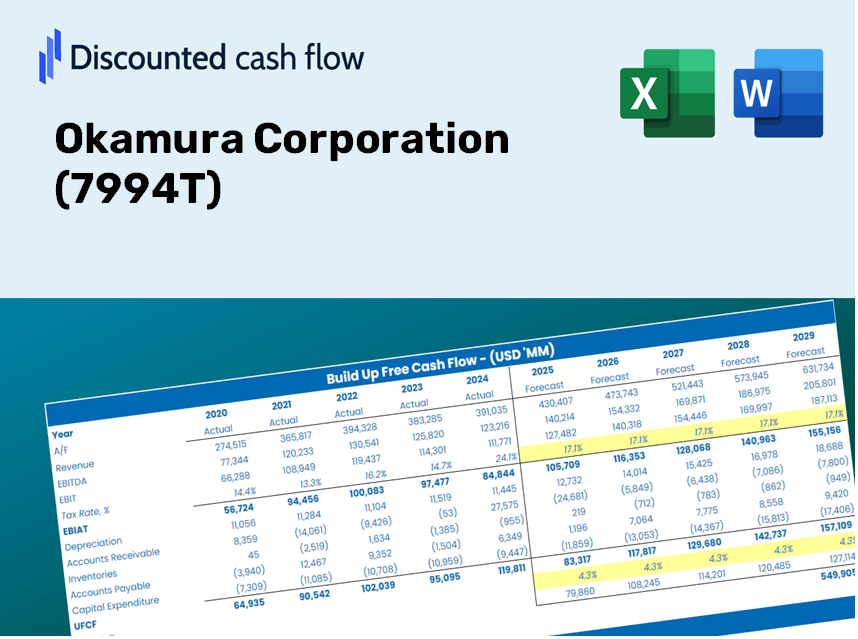
Gewinnen Sie Einblicke in Ihre Bewertungsanalyse für die Okamura Corporation (7994T) unter Verwendung unseres hochmodernen DCF-Taschenrechners! Diese Excel -Vorlage wird mit realen (7994T) Daten vorinstalliert, sodass Sie Prognosen und Annahmen für eine genaue Berechnung des inneren Wertes der Okamura Corporation anpassen können.
Discounted Cash Flow (DCF) - (USD MM)
| Year | AY1 2021 |
AY2 2022 |
AY3 2023 |
AY4 2024 |
AY5 2025 |
FY1 2026 |
FY2 2027 |
FY3 2028 |
FY4 2029 |
FY5 2030 |
|---|---|---|---|---|---|---|---|---|---|---|
| Revenue | 244,454.0 | 261,175.0 | 277,015.0 | 298,295.0 | 314,527.0 | 334,993.7 | 356,792.2 | 380,009.1 | 404,736.8 | 431,073.6 |
| Revenue Growth, % | 0 | 6.84 | 6.06 | 7.68 | 5.44 | 6.51 | 6.51 | 6.51 | 6.51 | 6.51 |
| EBITDA | 20,181.0 | 27,558.0 | 29,541.0 | 36,244.0 | 37,573.0 | 35,889.5 | 38,224.9 | 40,712.2 | 43,361.4 | 46,183.0 |
| EBITDA, % | 8.26 | 10.55 | 10.66 | 12.15 | 11.95 | 10.71 | 10.71 | 10.71 | 10.71 | 10.71 |
| Depreciation | 6,005.0 | 5,737.0 | 6,213.0 | 6,532.0 | 6,789.0 | 7,533.5 | 8,023.7 | 8,545.8 | 9,101.9 | 9,694.2 |
| Depreciation, % | 2.46 | 2.2 | 2.24 | 2.19 | 2.16 | 2.25 | 2.25 | 2.25 | 2.25 | 2.25 |
| EBIT | 14,176.0 | 21,821.0 | 23,328.0 | 29,712.0 | 30,784.0 | 28,356.0 | 30,201.2 | 32,166.4 | 34,259.5 | 36,488.8 |
| EBIT, % | 5.8 | 8.35 | 8.42 | 9.96 | 9.79 | 8.46 | 8.46 | 8.46 | 8.46 | 8.46 |
| Total Cash | 45,166.0 | 39,952.0 | 39,025.0 | 39,173.0 | 26,245.0 | 46,455.3 | 49,478.2 | 52,697.8 | 56,126.9 | 59,779.2 |
| Total Cash, percent | .0 | .0 | .0 | .0 | .0 | .0 | .0 | .0 | .0 | .0 |
| Account Receivables | 66,807.0 | 68,772.0 | 73,414.0 | 81,260.0 | 87,621.0 | 90,623.9 | 96,521.0 | 102,801.7 | 109,491.2 | 116,615.9 |
| Account Receivables, % | 27.33 | 26.33 | 26.5 | 27.24 | 27.86 | 27.05 | 27.05 | 27.05 | 27.05 | 27.05 |
| Inventories | 14,797.0 | 20,648.0 | 21,164.0 | 21,347.0 | 22,212.0 | 23,997.1 | 25,558.7 | 27,221.8 | 28,993.1 | 30,879.8 |
| Inventories, % | 6.05 | 7.91 | 7.64 | 7.16 | 7.06 | 7.16 | 7.16 | 7.16 | 7.16 | 7.16 |
| Accounts Payable | 27,850.0 | 29,213.0 | 28,906.0 | 28,906.0 | 28,230.0 | 34,624.0 | 36,877.0 | 39,276.6 | 41,832.4 | 44,554.5 |
| Accounts Payable, % | 11.39 | 11.19 | 10.43 | 9.69 | 8.98 | 10.34 | 10.34 | 10.34 | 10.34 | 10.34 |
| Capital Expenditure | -5,774.0 | -6,057.0 | -13,380.0 | -17,058.0 | -16,458.0 | -13,709.5 | -14,601.6 | -15,551.7 | -16,563.7 | -17,641.5 |
| Capital Expenditure, % | -2.36 | -2.32 | -4.83 | -5.72 | -5.23 | -4.09 | -4.09 | -4.09 | -4.09 | -4.09 |
| Tax Rate, % | 27.67 | 27.67 | 27.67 | 27.67 | 27.67 | 27.67 | 27.67 | 27.67 | 27.67 | 27.67 |
| EBITAT | 9,424.2 | 15,096.5 | 16,029.7 | 20,386.4 | 22,265.6 | 19,583.7 | 20,858.1 | 22,215.3 | 23,660.9 | 25,200.6 |
| Depreciation | ||||||||||
| Changes in Account Receivables | ||||||||||
| Changes in Inventories | ||||||||||
| Changes in Accounts Payable | ||||||||||
| Capital Expenditure | ||||||||||
| UFCF | -44,098.8 | 8,323.5 | 3,397.7 | 1,831.4 | 4,694.6 | 15,013.6 | 9,074.7 | 9,665.2 | 10,294.1 | 10,963.9 |
| WACC, % | 4.23 | 4.24 | 4.24 | 4.24 | 4.26 | 4.24 | 4.24 | 4.24 | 4.24 | 4.24 |
| PV UFCF | ||||||||||
| SUM PV UFCF | 48,913.8 | |||||||||
| Long Term Growth Rate, % | 3.00 | |||||||||
| Free cash flow (T + 1) | 11,293 | |||||||||
| Terminal Value | 910,366 | |||||||||
| Present Terminal Value | 739,663 | |||||||||
| Enterprise Value | 788,577 | |||||||||
| Net Debt | 9,594 | |||||||||
| Equity Value | 778,983 | |||||||||
| Diluted Shares Outstanding, MM | 95 | |||||||||
| Equity Value Per Share | 8,230.93 |
What You Will Receive
- Accurate OKAM Financial Data: Pre-filled with Okamura Corporation’s historical and projected figures for thorough analysis.
- Fully Customizable Template: Easily adjust key inputs such as revenue growth, WACC, and EBITDA %.
- Instantaneous Calculations: Watch OKAM’s intrinsic value refresh in real-time as you make modifications.
- Professional Valuation Tool: Tailored for investors, analysts, and consultants aiming for precise DCF outcomes.
- User-Friendly Interface: Streamlined layout and clear instructions suitable for all skill levels.
Key Features
- 🔍 Real-Life Okamura Financials: Pre-filled historical and projected data for Okamura Corporation (7994T).
- ✏️ Fully Customizable Inputs: Modify all key parameters (yellow cells) such as WACC, growth %, and tax rates.
- 📊 Professional DCF Valuation: Integrated formulas compute Okamura’s intrinsic value using the Discounted Cash Flow method.
- ⚡ Instant Results: Immediately visualize Okamura’s valuation after making adjustments.
- Scenario Analysis: Evaluate and compare results for different financial assumptions side-by-side.
How It Operates
- Step 1: Download the Excel file.
- Step 2: Examine the pre-filled Okamura Corporation (7994T) data (both historical and projected).
- Step 3: Modify key assumptions (highlighted in yellow) according to your analysis.
- Step 4: Observe automatic updates for the intrinsic value of Okamura Corporation (7994T).
- Step 5: Utilize the results for investment choices or reporting purposes.
Why Opt for This Calculator for Okamura Corporation (7994T)?
- Precision: Leverages accurate financial data from Okamura Corporation for reliable results.
- Versatility: Tailored for users to easily adjust and experiment with various inputs.
- Efficiency: Bypass the complexities of creating a DCF model from the ground up.
- High-Quality Standards: Crafted with the expertise and attention to detail expected from CFO-level tools.
- Accessible: Intuitive design makes it simple for users with any level of financial modeling knowledge.
Who Can Benefit from Okamura Corporation (7994T)?
- Finance Students: Explore valuation methods and practice with real data relevant to Okamura Corporation (7994T).
- Academics: Utilize industry models in your research or coursework focused on Okamura Corporation (7994T).
- Investors: Validate your investment strategies and evaluate valuation metrics specific to Okamura Corporation (7994T).
- Analysts: Enhance your analysis process with a customizable DCF model designed for Okamura Corporation (7994T).
- Small Business Owners: Discover how large public companies like Okamura Corporation (7994T) are assessed in the market.
What the Template Contains
- Operating and Balance Sheet Data: Pre-filled Okamura Corporation (7994T) historical data and forecasts, including revenue, EBITDA, EBIT, and capital expenditures.
- WACC Calculation: A dedicated sheet for Weighted Average Cost of Capital (WACC), featuring parameters such as Beta, risk-free rate, and share price.
- DCF Valuation (Unlevered and Levered): Editable Discounted Cash Flow models displaying intrinsic value with comprehensive calculations.
- Financial Statements: Pre-loaded financial statements (annual and quarterly) to facilitate analysis.
- Key Ratios: Incorporates profitability, leverage, and efficiency ratios for Okamura Corporation (7994T).
- Dashboard and Charts: Visual summary of valuation outputs and assumptions for easy results analysis.
Disclaimer
All information, articles, and product details provided on this website are for general informational and educational purposes only. We do not claim any ownership over, nor do we intend to infringe upon, any trademarks, copyrights, logos, brand names, or other intellectual property mentioned or depicted on this site. Such intellectual property remains the property of its respective owners, and any references here are made solely for identification or informational purposes, without implying any affiliation, endorsement, or partnership.
We make no representations or warranties, express or implied, regarding the accuracy, completeness, or suitability of any content or products presented. Nothing on this website should be construed as legal, tax, investment, financial, medical, or other professional advice. In addition, no part of this site—including articles or product references—constitutes a solicitation, recommendation, endorsement, advertisement, or offer to buy or sell any securities, franchises, or other financial instruments, particularly in jurisdictions where such activity would be unlawful.
All content is of a general nature and may not address the specific circumstances of any individual or entity. It is not a substitute for professional advice or services. Any actions you take based on the information provided here are strictly at your own risk. You accept full responsibility for any decisions or outcomes arising from your use of this website and agree to release us from any liability in connection with your use of, or reliance upon, the content or products found herein.