
|
Marubeni Corporation (8002.T) DCF -Bewertung |
Fully Editable: Tailor To Your Needs In Excel Or Sheets
Professional Design: Trusted, Industry-Standard Templates
Investor-Approved Valuation Models
MAC/PC Compatible, Fully Unlocked
No Expertise Is Needed; Easy To Follow
Marubeni Corporation (8002.T) Bundle
Optimieren Sie Ihre Zeit und verbessern Sie die Präzision mit unserem DCF -Taschenrechner (8002T)! Mit realen Daten von Marubeni Corporation und anpassbaren Annahmen ermöglichen dieses Tool Sie, wie ein erfahrener Investor prognostiziert, analysieren und value (8002T).
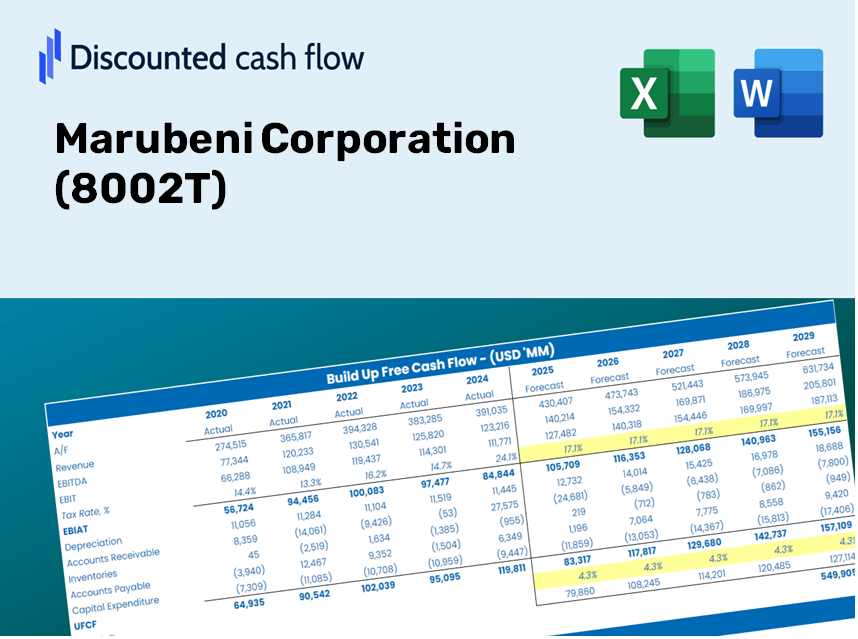
Discounted Cash Flow (DCF) - (USD MM)
| Year | AY1 2021 |
AY2 2022 |
AY3 2023 |
AY4 2024 |
AY5 2025 |
FY1 2026 |
FY2 2027 |
FY3 2028 |
FY4 2029 |
FY5 2030 |
|---|---|---|---|---|---|---|---|---|---|---|
| Revenue | 6,332,414.0 | 8,508,591.0 | 9,190,472.0 | 7,250,515.0 | 7,790,168.0 | 8,349,391.4 | 8,948,759.1 | 9,591,152.9 | 10,279,661.5 | 11,017,595.1 |
| Revenue Growth, % | 0 | 34.37 | 8.01 | -21.11 | 7.44 | 7.18 | 7.18 | 7.18 | 7.18 | 7.18 |
| EBITDA | 307,842.0 | 457,111.0 | 578,299.0 | 505,956.0 | 616,018.0 | 524,541.0 | 562,195.6 | 602,553.3 | 645,808.1 | 692,167.9 |
| EBITDA, % | 4.86 | 5.37 | 6.29 | 6.98 | 7.91 | 6.28 | 6.28 | 6.28 | 6.28 | 6.28 |
| Depreciation | 144,417.0 | 143,039.0 | 156,539.0 | 177,666.0 | 199,321.0 | 178,242.8 | 191,038.1 | 204,752.0 | 219,450.2 | 235,203.6 |
| Depreciation, % | 2.28 | 1.68 | 1.7 | 2.45 | 2.56 | 2.13 | 2.13 | 2.13 | 2.13 | 2.13 |
| EBIT | 163,425.0 | 314,072.0 | 421,760.0 | 328,290.0 | 416,697.0 | 346,298.2 | 371,157.5 | 397,801.4 | 426,357.8 | 456,964.3 |
| EBIT, % | 2.58 | 3.69 | 4.59 | 4.53 | 5.35 | 4.15 | 4.15 | 4.15 | 4.15 | 4.15 |
| Total Cash | 745,977.0 | 578,716.0 | 610,311.0 | 506,269.0 | 569,527.0 | 659,867.5 | 707,236.6 | 758,006.2 | 812,420.2 | 870,740.5 |
| Total Cash, percent | .0 | .0 | .0 | .0 | .0 | .0 | .0 | .0 | .0 | .0 |
| Account Receivables | 1,057,245.0 | 1,344,966.0 | 1,337,276.0 | 1,551,091.0 | 1,518,734.0 | 1,468,523.7 | 1,573,942.8 | 1,686,929.6 | 1,808,027.1 | 1,937,817.8 |
| Account Receivables, % | 16.7 | 15.81 | 14.55 | 21.39 | 19.5 | 17.59 | 17.59 | 17.59 | 17.59 | 17.59 |
| Inventories | 988,004.0 | 1,429,006.0 | 1,157,864.0 | 1,178,733.0 | 1,180,366.0 | 1,275,869.5 | 1,367,458.9 | 1,465,623.0 | 1,570,833.9 | 1,683,597.5 |
| Inventories, % | 15.6 | 16.79 | 12.6 | 16.26 | 15.15 | 15.28 | 15.28 | 15.28 | 15.28 | 15.28 |
| Accounts Payable | 1,187,719.0 | 1,493,526.0 | 1,308,657.0 | 1,371,078.0 | 1,339,974.0 | 1,447,108.6 | 1,550,990.5 | 1,662,329.5 | 1,781,661.2 | 1,909,559.2 |
| Accounts Payable, % | 18.76 | 17.55 | 14.24 | 18.91 | 17.2 | 17.33 | 17.33 | 17.33 | 17.33 | 17.33 |
| Capital Expenditure | -124,090.0 | -101,805.0 | -104,260.0 | -153,371.0 | -177,554.0 | -145,029.8 | -155,440.9 | -166,599.3 | -178,558.8 | -191,376.7 |
| Capital Expenditure, % | -1.96 | -1.2 | -1.13 | -2.12 | -2.28 | -1.74 | -1.74 | -1.74 | -1.74 | -1.74 |
| Tax Rate, % | 20.06 | 20.06 | 20.06 | 20.06 | 20.06 | 20.06 | 20.06 | 20.06 | 20.06 | 20.06 |
| EBITAT | 127,221.1 | 250,258.0 | 349,739.0 | 272,328.5 | 333,092.3 | 279,353.3 | 299,406.9 | 320,900.1 | 343,936.2 | 368,625.9 |
| Depreciation | ||||||||||
| Changes in Account Receivables | ||||||||||
| Changes in Inventories | ||||||||||
| Changes in Accounts Payable | ||||||||||
| Capital Expenditure | ||||||||||
| UFCF | -709,981.9 | -131,424.0 | 495,981.0 | 124,360.5 | 354,479.3 | 374,407.8 | 241,877.6 | 259,241.0 | 277,850.8 | 297,796.5 |
| WACC, % | 5.45 | 5.47 | 5.51 | 5.51 | 5.47 | 5.48 | 5.48 | 5.48 | 5.48 | 5.48 |
| PV UFCF | ||||||||||
| SUM PV UFCF | 1,245,730.5 | |||||||||
| Long Term Growth Rate, % | 2.00 | |||||||||
| Free cash flow (T + 1) | 303,752 | |||||||||
| Terminal Value | 8,724,819 | |||||||||
| Present Terminal Value | 6,681,523 | |||||||||
| Enterprise Value | 7,927,253 | |||||||||
| Net Debt | 2,207,610 | |||||||||
| Equity Value | 5,719,643 | |||||||||
| Diluted Shares Outstanding, MM | 1,663 | |||||||||
| Equity Value Per Share | 3,440.15 |
What You Will Receive
- Adjustable Forecast Inputs: Easily modify key assumptions (growth %, margins, WACC) to generate various scenarios.
- Comprehensive Data: Marubeni Corporation's financial information pre-loaded to enhance your analysis.
- Automated DCF Outputs: The template computes Net Present Value (NPV) and intrinsic value on your behalf.
- Customizable and Professional Design: A refined Excel model tailored to meet your valuation requirements.
- Designed for Analysts and Investors: Perfect for evaluating projections, validating strategies, and increasing efficiency.
Key Features
- Accurate Marubeni Financial Data: Access reliable historical data and future forecasts pre-loaded for your convenience.
- Customizable Assumptions: Modify highlighted cells, including WACC, growth rates, and profit margins.
- Real-Time Calculations: Automatic updates to DCF, Net Present Value (NPV), and cash flow assessments.
- User-Friendly Dashboard: Intuitive charts and overviews to help you visualize your valuation outcomes.
- Designed for All Users: A structured layout suitable for investors, CFOs, and consultants, whether seasoned or newcomers.
How It Functions
- Download: Obtain the pre-built Excel file containing Marubeni Corporation's (8002T) financial data.
- Customize: Tailor your forecasts, including revenue growth, EBITDA percentage, and WACC.
- Update Automatically: Intrinsic value and NPV calculations refresh in real-time.
- Test Scenarios: Generate various projections and instantly compare the results.
- Make Decisions: Leverage the valuation findings to inform your investment strategy.
Why Select This Calculator for Marubeni Corporation (8002T)?
- All-in-One Solution: Features DCF, WACC, and financial ratio analyses seamlessly integrated.
- Flexible Inputs: Modify the yellow-highlighted cells to explore different financial scenarios.
- In-Depth Analysis: Automatically computes Marubeni’s intrinsic value and Net Present Value.
- Preloaded Information: Includes historical and projected data for reliable starting points.
- Professional-Grade: Perfect for financial analysts, investors, and consultants working with Marubeni Corporation (8002T).
Who Can Benefit from This Product?
- Investors: Evaluate Marubeni Corporation's (8002T) valuation prior to making investment decisions.
- CFOs and Financial Analysts: Optimize valuation workflows and assess financial forecasts.
- Startup Founders: Gain insights into how major corporations like Marubeni Corporation (8002T) are appraised.
- Consultants: Provide clients with comprehensive valuation analyses and reports.
- Students and Educators: Leverage real-world data to practice and educate on valuation methodologies.
Contents of the Template
- Operating and Balance Sheet Data: Pre-filled Marubeni Corporation (8002T) historical data and forecasts, encompassing revenue, EBITDA, EBIT, and capital expenditures.
- WACC Calculation: A dedicated sheet for Weighted Average Cost of Capital (WACC), featuring key parameters such as Beta, risk-free rate, and share price.
- DCF Valuation (Unlevered and Levered): Customizable Discounted Cash Flow models illustrating intrinsic value with comprehensive calculations.
- Financial Statements: Pre-loaded financial statements (both annual and quarterly) to facilitate analysis.
- Key Ratios: A range of profitability, leverage, and efficiency ratios relevant to Marubeni Corporation (8002T).
- Dashboard and Charts: Visual overview of valuation outputs and assumptions, designed for straightforward results analysis.
Disclaimer
All information, articles, and product details provided on this website are for general informational and educational purposes only. We do not claim any ownership over, nor do we intend to infringe upon, any trademarks, copyrights, logos, brand names, or other intellectual property mentioned or depicted on this site. Such intellectual property remains the property of its respective owners, and any references here are made solely for identification or informational purposes, without implying any affiliation, endorsement, or partnership.
We make no representations or warranties, express or implied, regarding the accuracy, completeness, or suitability of any content or products presented. Nothing on this website should be construed as legal, tax, investment, financial, medical, or other professional advice. In addition, no part of this site—including articles or product references—constitutes a solicitation, recommendation, endorsement, advertisement, or offer to buy or sell any securities, franchises, or other financial instruments, particularly in jurisdictions where such activity would be unlawful.
All content is of a general nature and may not address the specific circumstances of any individual or entity. It is not a substitute for professional advice or services. Any actions you take based on the information provided here are strictly at your own risk. You accept full responsibility for any decisions or outcomes arising from your use of this website and agree to release us from any liability in connection with your use of, or reliance upon, the content or products found herein.