
|
Kanematsu Corporation (8020.T) DCF -Bewertung |
Fully Editable: Tailor To Your Needs In Excel Or Sheets
Professional Design: Trusted, Industry-Standard Templates
Investor-Approved Valuation Models
MAC/PC Compatible, Fully Unlocked
No Expertise Is Needed; Easy To Follow
Kanematsu Corporation (8020.T) Bundle
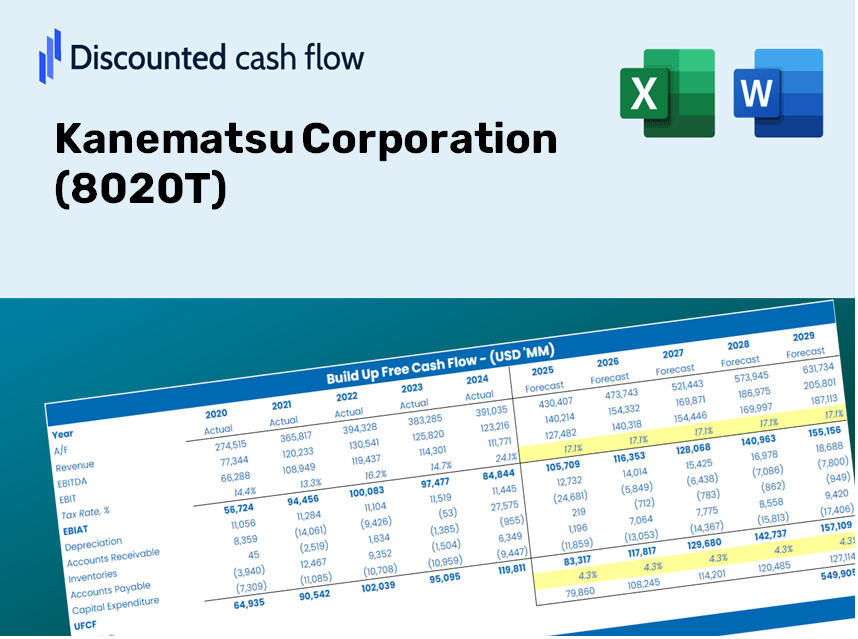
Meister Sie Ihre Kalematsu Corporation (8020T) Bewertungsanalyse mit unserem hochmodernen DCF-Taschenrechner! Diese Excel -Vorlage wird mit realen (8020T) Daten vorinstalliert, sodass Sie die Vorhersagen und Annahmen für genaue Berechnungen des intrinsischen Wertes der Kanematsu Corporation anpassen können.
Discounted Cash Flow (DCF) - (USD MM)
| Year | AY1 2020 |
AY2 2021 |
AY3 2022 |
AY4 2023 |
AY5 2024 |
FY1 2025 |
FY2 2026 |
FY3 2027 |
FY4 2028 |
FY5 2029 |
|---|---|---|---|---|---|---|---|---|---|---|
| Revenue | 649,142.0 | 767,963.0 | 911,408.0 | 985,993.0 | 1,050,936.0 | 1,186,908.7 | 1,340,473.9 | 1,513,907.8 | 1,709,781.0 | 1,930,996.7 |
| Revenue Growth, % | 0 | 18.3 | 18.68 | 8.18 | 6.59 | 12.94 | 12.94 | 12.94 | 12.94 | 12.94 |
| EBITDA | 36,471.0 | 42,937.0 | 54,494.0 | 58,780.0 | 59,976.0 | 68,501.0 | 77,363.8 | 87,373.3 | 98,677.9 | 111,445.1 |
| EBITDA, % | 5.62 | 5.59 | 5.98 | 5.96 | 5.71 | 5.77 | 5.77 | 5.77 | 5.77 | 5.77 |
| Depreciation | 11,555.0 | 12,242.0 | 13,778.0 | 14,741.0 | 15,834.0 | 18,723.6 | 21,146.1 | 23,882.1 | 26,972.0 | 30,461.7 |
| Depreciation, % | 1.78 | 1.59 | 1.51 | 1.5 | 1.51 | 1.58 | 1.58 | 1.58 | 1.58 | 1.58 |
| EBIT | 24,916.0 | 30,695.0 | 40,716.0 | 44,039.0 | 44,142.0 | 49,777.4 | 56,217.7 | 63,491.3 | 71,705.9 | 80,983.4 |
| EBIT, % | 3.84 | 4 | 4.47 | 4.47 | 4.2 | 4.19 | 4.19 | 4.19 | 4.19 | 4.19 |
| Total Cash | 81,045.0 | 91,420.0 | 79,462.0 | 53,431.0 | 56,779.0 | 104,280.5 | 117,772.6 | 133,010.3 | 150,219.5 | 169,655.3 |
| Total Cash, percent | .0 | .0 | .0 | .0 | .0 | .0 | .0 | .0 | .0 | .0 |
| Account Receivables | 207,285.0 | 236,453.0 | 245,890.0 | 287,119.0 | 254,127.0 | 339,460.0 | 383,380.2 | 432,982.8 | 489,003.2 | 552,271.7 |
| Account Receivables, % | 31.93 | 30.79 | 26.98 | 29.12 | 24.18 | 28.6 | 28.6 | 28.6 | 28.6 | 28.6 |
| Inventories | 99,711.0 | 121,018.0 | 156,071.0 | 158,784.0 | 155,597.0 | 187,893.4 | 212,203.6 | 239,659.0 | 270,666.7 | 305,686.2 |
| Inventories, % | 15.36 | 15.76 | 17.12 | 16.1 | 14.81 | 15.83 | 15.83 | 15.83 | 15.83 | 15.83 |
| Accounts Payable | 171,177.0 | 200,685.0 | 191,177.0 | 239,563.0 | 208,695.0 | 279,238.1 | 315,366.6 | 356,169.5 | 402,251.6 | 454,295.9 |
| Accounts Payable, % | 26.37 | 26.13 | 20.98 | 24.3 | 19.86 | 23.53 | 23.53 | 23.53 | 23.53 | 23.53 |
| Capital Expenditure | -5,471.0 | -4,307.0 | -5,537.0 | -4,757.0 | -9,068.0 | -7,967.6 | -8,998.5 | -10,162.8 | -11,477.7 | -12,962.7 |
| Capital Expenditure, % | -0.8428 | -0.56083 | -0.60752 | -0.48246 | -0.86285 | -0.67129 | -0.67129 | -0.67129 | -0.67129 | -0.67129 |
| Tax Rate, % | 27.99 | 27.99 | 27.99 | 27.99 | 27.99 | 27.99 | 27.99 | 27.99 | 27.99 | 27.99 |
| EBITAT | 14,069.4 | 17,058.6 | 21,187.2 | 27,456.2 | 31,784.7 | 29,710.0 | 33,554.0 | 37,895.3 | 42,798.3 | 48,335.7 |
| Depreciation | ||||||||||
| Changes in Account Receivables | ||||||||||
| Changes in Inventories | ||||||||||
| Changes in Accounts Payable | ||||||||||
| Capital Expenditure | ||||||||||
| UFCF | -115,665.6 | 4,026.6 | -24,569.8 | 41,884.2 | 43,861.7 | -6,620.3 | 13,599.8 | 15,359.4 | 17,346.7 | 19,591.0 |
| WACC, % | 3.43 | 3.41 | 3.36 | 3.52 | 3.68 | 3.48 | 3.48 | 3.48 | 3.48 | 3.48 |
| PV UFCF | ||||||||||
| SUM PV UFCF | 51,802.7 | |||||||||
| Long Term Growth Rate, % | 2.00 | |||||||||
| Free cash flow (T + 1) | 19,983 | |||||||||
| Terminal Value | 1,349,843 | |||||||||
| Present Terminal Value | 1,137,610 | |||||||||
| Enterprise Value | 1,189,412 | |||||||||
| Net Debt | 146,477 | |||||||||
| Equity Value | 1,042,935 | |||||||||
| Diluted Shares Outstanding, MM | 84 | |||||||||
| Equity Value Per Share | 12,440.78 |
What You Will Receive
- Genuine Kanematsu Data: Preloaded financials – encompassing revenue to EBIT – based on actual and projected figures.
- Comprehensive Customization: Modify all essential parameters (yellow cells) such as WACC, growth %, and tax rates.
- Immediate Valuation Refresh: Automatic recalculations to assess the impact of any changes on Kanematsu’s fair value.
- Flexible Excel Template: Designed for quick edits, scenario testing, and detailed forecasting.
- Efficiency and Accuracy: Eliminate the need to build models from the ground up while ensuring precision and adaptability.
Key Features
- Comprehensive DCF Calculator: Provides detailed unlevered and levered DCF valuation models tailored for Kanematsu Corporation (8020T).
- WACC Calculator: Features a customizable Weighted Average Cost of Capital sheet for precise calculations.
- Adjustable Forecast Assumptions: Easily modify growth rates, capital expenditures, and discount rates as needed.
- Integrated Financial Ratios: Evaluate profitability, leverage, and efficiency ratios specifically for Kanematsu Corporation (8020T).
- Dashboard and Visual Charts: User-friendly visual outputs that summarize essential valuation metrics for effective analysis.
How It Works
- Step 1: Download the Excel spreadsheet.
- Step 2: Examine the pre-filled Kanematsu Corporation (8020T) data (both historical and projected).
- Step 3: Modify key assumptions (highlighted in yellow) according to your analysis.
- Step 4: Observe the automatic updates reflecting Kanematsu Corporation’s intrinsic value.
- Step 5: Utilize the results for making investment decisions or for reporting purposes.
Why Choose This Calculator?
- Accurate Data: Authentic Kanematsu Corporation (8020T) financials ensure dependable valuation outcomes.
- Customizable: Modify essential parameters such as growth rates, WACC, and tax rates to align with your forecasts.
- Time-Saving: Pre-defined calculations remove the hassle of starting from the beginning.
- Professional-Grade Tool: Tailored for investors, analysts, and consultants alike.
- User-Friendly: An intuitive design and step-by-step guidance make it accessible for all users.
Who Can Benefit from This Product?
- Finance Students: Master valuation techniques and apply them to real-world data.
- Academics: Integrate professional models into your curriculum or research initiatives.
- Investors: Validate your hypotheses and assess valuation results for Kanematsu Corporation (8020T).
- Analysts: Optimize your workflow with a ready-to-use, customizable DCF model.
- Small Business Owners: Understand the analytical processes used for large public corporations like Kanematsu Corporation (8020T).
What the Template Includes
- Pre-Filled DCF Model: Kanematsu Corporation’s financial data ready for immediate analysis.
- WACC Calculator: Comprehensive calculations for the Weighted Average Cost of Capital.
- Financial Ratios: Assess Kanematsu Corporation's profitability, leverage, and operational efficiency.
- Editable Inputs: Adjust assumptions like growth rates, margins, and CAPEX to suit your specific scenarios.
- Financial Statements: Access annual and quarterly reports for in-depth analysis.
- Interactive Dashboard: Effortlessly visualize essential valuation metrics and outcomes.
Disclaimer
All information, articles, and product details provided on this website are for general informational and educational purposes only. We do not claim any ownership over, nor do we intend to infringe upon, any trademarks, copyrights, logos, brand names, or other intellectual property mentioned or depicted on this site. Such intellectual property remains the property of its respective owners, and any references here are made solely for identification or informational purposes, without implying any affiliation, endorsement, or partnership.
We make no representations or warranties, express or implied, regarding the accuracy, completeness, or suitability of any content or products presented. Nothing on this website should be construed as legal, tax, investment, financial, medical, or other professional advice. In addition, no part of this site—including articles or product references—constitutes a solicitation, recommendation, endorsement, advertisement, or offer to buy or sell any securities, franchises, or other financial instruments, particularly in jurisdictions where such activity would be unlawful.
All content is of a general nature and may not address the specific circumstances of any individual or entity. It is not a substitute for professional advice or services. Any actions you take based on the information provided here are strictly at your own risk. You accept full responsibility for any decisions or outcomes arising from your use of this website and agree to release us from any liability in connection with your use of, or reliance upon, the content or products found herein.