
|
Tokyo Electron Limited (8035.T) DCF -Bewertung |
Fully Editable: Tailor To Your Needs In Excel Or Sheets
Professional Design: Trusted, Industry-Standard Templates
Investor-Approved Valuation Models
MAC/PC Compatible, Fully Unlocked
No Expertise Is Needed; Easy To Follow
Tokyo Electron Limited (8035.T) Bundle
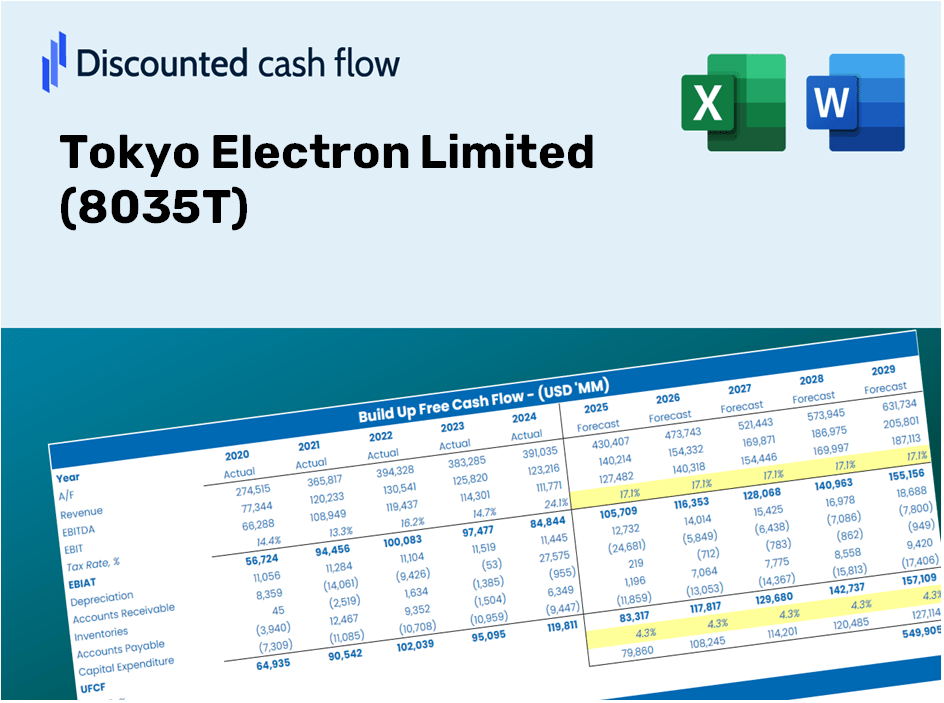
Bewerten Sie den finanziellen Ausblick von Tokyo Electron Limited (8035T) wie ein Experte! Dieser (8035T) DCF-Taschenrechner bietet Ihnen vorgefüllte Finanzdaten und die Flexibilität, das Umsatzwachstum, WACC, Margen und andere wichtige Annahmen zu ändern, um sich an Ihren Projektionen anzupassen.
Discounted Cash Flow (DCF) - (USD MM)
| Year | AY1 2020 |
AY2 2021 |
AY3 2022 |
AY4 2023 |
AY5 2024 |
FY1 2025 |
FY2 2026 |
FY3 2027 |
FY4 2028 |
FY5 2029 |
|---|---|---|---|---|---|---|---|---|---|---|
| Revenue | 1,399,102.0 | 2,003,805.0 | 2,209,025.0 | 1,830,527.0 | 2,431,568.0 | 2,852,001.1 | 3,345,129.6 | 3,923,523.0 | 4,601,924.3 | 5,397,625.3 |
| Revenue Growth, % | 0 | 43.22 | 10.24 | -17.13 | 32.83 | 17.29 | 17.29 | 17.29 | 17.29 | 17.29 |
| EBITDA | 354,728.0 | 636,204.0 | 660,819.0 | 508,676.0 | 768,380.0 | 835,105.7 | 979,500.6 | 1,148,862.2 | 1,347,507.6 | 1,580,499.9 |
| EBITDA, % | 25.35 | 31.75 | 29.91 | 27.79 | 31.6 | 29.28 | 29.28 | 29.28 | 29.28 | 29.28 |
| Depreciation | 34,042.0 | 36,933.0 | 43,095.0 | 52,412.0 | 62,265.0 | 66,457.6 | 77,948.5 | 91,426.3 | 107,234.5 | 125,776.0 |
| Depreciation, % | 2.43 | 1.84 | 1.95 | 2.86 | 2.56 | 2.33 | 2.33 | 2.33 | 2.33 | 2.33 |
| EBIT | 320,686.0 | 599,271.0 | 617,724.0 | 456,264.0 | 706,115.0 | 768,648.1 | 901,552.0 | 1,057,435.9 | 1,240,273.1 | 1,454,723.9 |
| EBIT, % | 22.92 | 29.91 | 27.96 | 24.93 | 29.04 | 26.95 | 26.95 | 26.95 | 26.95 | 26.95 |
| Total Cash | 311,552.0 | 371,274.0 | 473,099.0 | 472,548.0 | 496,238.0 | 618,519.7 | 725,465.6 | 850,903.1 | 998,029.4 | 1,170,594.9 |
| Total Cash, percent | .0 | .0 | .0 | .0 | .0 | .0 | .0 | .0 | .0 | .0 |
| Account Receivables | 191,601.0 | 433,788.0 | 464,705.0 | 391,423.0 | 485,466.0 | 557,438.8 | 653,823.4 | 766,873.4 | 899,470.6 | 1,054,994.6 |
| Account Receivables, % | 13.69 | 21.65 | 21.04 | 21.38 | 19.97 | 19.55 | 19.55 | 19.55 | 19.55 | 19.55 |
| Inventories | 415,342.0 | 473,844.0 | 652,207.0 | 762,956.0 | 749,124.0 | 886,094.2 | 1,039,305.3 | 1,219,007.6 | 1,429,781.5 | 1,676,999.5 |
| Inventories, % | 29.69 | 23.65 | 29.52 | 41.68 | 30.81 | 31.07 | 31.07 | 31.07 | 31.07 | 31.07 |
| Accounts Payable | 90,606.0 | 120,908.0 | 116,317.0 | 92,359.0 | 108,036.0 | 155,514.0 | 182,403.3 | 213,942.0 | 250,933.8 | 294,321.9 |
| Accounts Payable, % | 6.48 | 6.03 | 5.27 | 5.05 | 4.44 | 5.45 | 5.45 | 5.45 | 5.45 | 5.45 |
| Capital Expenditure | -60,930.0 | -65,103.0 | -76,313.0 | -124,980.0 | -158,374.0 | -139,173.6 | -163,237.6 | -191,462.4 | -224,567.4 | -263,396.5 |
| Capital Expenditure, % | -4.35 | -3.25 | -3.45 | -6.83 | -6.51 | -4.88 | -4.88 | -4.88 | -4.88 | -4.88 |
| Tax Rate, % | 22.94 | 22.94 | 22.94 | 22.94 | 22.94 | 22.94 | 22.94 | 22.94 | 22.94 | 22.94 |
| EBITAT | 245,736.4 | 438,960.7 | 466,201.4 | 350,759.5 | 544,133.8 | 583,073.3 | 683,890.2 | 802,139.0 | 940,833.8 | 1,103,509.8 |
| Depreciation | ||||||||||
| Changes in Account Receivables | ||||||||||
| Changes in Inventories | ||||||||||
| Changes in Accounts Payable | ||||||||||
| Capital Expenditure | ||||||||||
| UFCF | -297,488.6 | 140,403.7 | 219,112.4 | 216,766.5 | 383,490.8 | 348,892.3 | 375,894.8 | 440,889.3 | 517,121.7 | 606,535.3 |
| WACC, % | 9.95 | 9.95 | 9.95 | 9.95 | 9.95 | 9.95 | 9.95 | 9.95 | 9.95 | 9.95 |
| PV UFCF | ||||||||||
| SUM PV UFCF | 1,691,379.6 | |||||||||
| Long Term Growth Rate, % | 2.00 | |||||||||
| Free cash flow (T + 1) | 618,666 | |||||||||
| Terminal Value | 7,784,234 | |||||||||
| Present Terminal Value | 4,844,908 | |||||||||
| Enterprise Value | 6,536,287 | |||||||||
| Net Debt | -416,240 | |||||||||
| Equity Value | 6,952,527 | |||||||||
| Diluted Shares Outstanding, MM | 461 | |||||||||
| Equity Value Per Share | 15,065.39 |
What You Will Receive
- Authentic TOKYO Financial Data: Comes pre-loaded with Tokyo Electron's historical and projected figures for accurate analysis.
- Completely Customizable Template: Easily adjust key metrics such as revenue growth, WACC, and EBITDA percentage.
- Instant Calculations: Watch the intrinsic value of Tokyo Electron update in real time as you make modifications.
- Expert Valuation Tool: Tailored for investors, analysts, and consultants aiming for precise DCF outcomes.
- Intuitive Design: Streamlined layout and clear guidance suitable for users of all experience levels.
Key Features
- Customizable Forecast Inputs: Adjust essential metrics such as revenue growth, EBITDA percentage, and capital expenditures for precise modeling.
- Instant DCF Valuation: Quickly calculates intrinsic value, net present value, and other critical financial metrics.
- High Precision Outcomes: Leverages Tokyo Electron Limited's (8035T) actual financial data for accurate valuation results.
- Simplified Scenario Testing: Easily assess various assumptions and analyze resultant impacts.
- Efficiency-Boosting Tool: Streamline your workflow by avoiding the complexities of building valuation models from ground zero.
How It Functions
- Download the Template: Gain immediate access to the Excel-based TELO DCF Calculator.
- Input Your Assumptions: Modify the yellow-highlighted cells for growth rates, WACC, margins, and additional parameters.
- Instant Calculations: The model automatically recalculates Tokyo Electron Limited’s intrinsic value.
- Test Scenarios: Explore various assumptions to assess potential changes in valuation.
- Analyze and Decide: Utilize the results to inform your investment or financial strategy.
Why Opt for This Calculator?
- Precision: Incorporates authentic Tokyo Electron Limited (8035T) financial data for reliable results.
- Versatility: Crafted to allow users to experiment and adjust inputs as needed.
- Efficiency: Eliminate the complexity of constructing a DCF model from the ground up.
- Expert-Level: Built with the accuracy and usability expected by CFOs.
- Intuitive: Simple to navigate, suitable for users without extensive financial modeling knowledge.
Who Can Benefit from Tokyo Electron Limited (8035T) Products?
- Investors: Gain assurance in your investment choices with a top-tier analysis tool.
- Financial Analysts: Streamline your work with a pre-configured DCF model that's easy to customize.
- Consultants: Effortlessly modify the template for impactful client presentations or reports.
- Finance Enthusiasts: Enhance your grasp of valuation methodologies through practical, real-life examples.
- Educators and Students: Utilize it as a hands-on resource for finance-related coursework.
Contents of the Template
- Pre-Filled DCF Model: Tokyo Electron Limited’s financial data preloaded for immediate application.
- WACC Calculator: Comprehensive calculations for the Weighted Average Cost of Capital.
- Financial Ratios: Analyze Tokyo Electron Limited’s profitability, leverage, and efficiency metrics.
- Editable Inputs: Modify assumptions such as growth rates, margins, and CAPEX to suit your scenarios.
- Financial Statements: Access annual and quarterly reports for in-depth analysis.
- Interactive Dashboard: Effortlessly visualize essential valuation metrics and outcomes.
Disclaimer
All information, articles, and product details provided on this website are for general informational and educational purposes only. We do not claim any ownership over, nor do we intend to infringe upon, any trademarks, copyrights, logos, brand names, or other intellectual property mentioned or depicted on this site. Such intellectual property remains the property of its respective owners, and any references here are made solely for identification or informational purposes, without implying any affiliation, endorsement, or partnership.
We make no representations or warranties, express or implied, regarding the accuracy, completeness, or suitability of any content or products presented. Nothing on this website should be construed as legal, tax, investment, financial, medical, or other professional advice. In addition, no part of this site—including articles or product references—constitutes a solicitation, recommendation, endorsement, advertisement, or offer to buy or sell any securities, franchises, or other financial instruments, particularly in jurisdictions where such activity would be unlawful.
All content is of a general nature and may not address the specific circumstances of any individual or entity. It is not a substitute for professional advice or services. Any actions you take based on the information provided here are strictly at your own risk. You accept full responsibility for any decisions or outcomes arising from your use of this website and agree to release us from any liability in connection with your use of, or reliance upon, the content or products found herein.