
|
Honbridge Holdings Limited (8137.HK) DCF -Bewertung |
Fully Editable: Tailor To Your Needs In Excel Or Sheets
Professional Design: Trusted, Industry-Standard Templates
Investor-Approved Valuation Models
MAC/PC Compatible, Fully Unlocked
No Expertise Is Needed; Easy To Follow
Honbridge Holdings Limited (8137.HK) Bundle
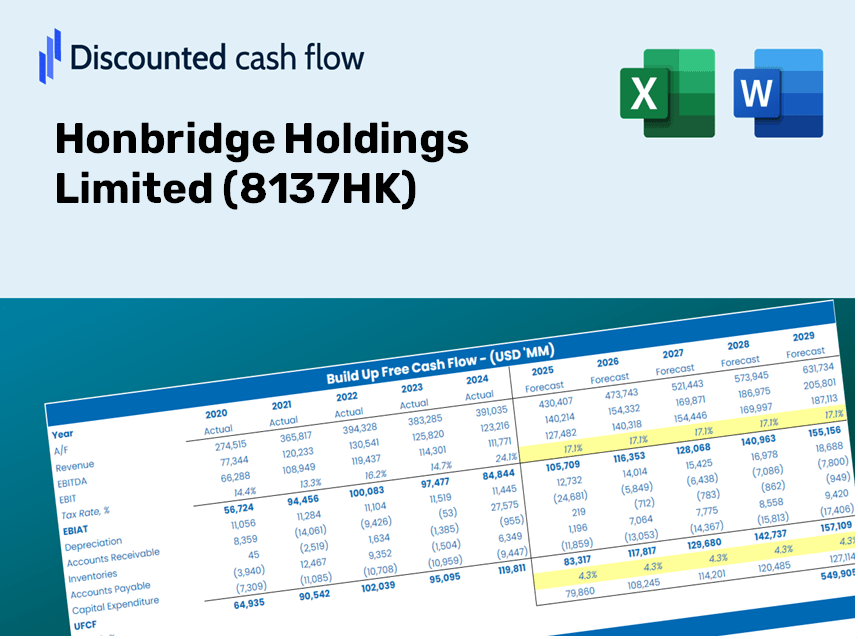
Gewinnen Sie Einblicke in Ihre Honbridge Holdings Limited (8137HK) Bewertungsanalyse mit unserem ausgefeilten DCF -Taschenrechner! Mit realen (8137HK-) Daten können Sie mit dieser Excel -Vorlage Prognosen und Annahmen anpassen, um den inneren Wert von Honbridge Holdings mit Genauigkeit begrenzt zu bestimmen.
Discounted Cash Flow (DCF) - (USD MM)
| Year | AY1 2020 |
AY2 2021 |
AY3 2022 |
AY4 2023 |
AY5 2024 |
FY1 2025 |
FY2 2026 |
FY3 2027 |
FY4 2028 |
FY5 2029 |
|---|---|---|---|---|---|---|---|---|---|---|
| Revenue | 297.1 | 478.9 | 130.5 | 227.0 | 126.1 | 131.8 | 137.7 | 143.9 | 150.3 | 157.1 |
| Revenue Growth, % | 0 | 61.22 | -72.75 | 73.93 | -44.43 | 4.49 | 4.49 | 4.49 | 4.49 | 4.49 |
| EBITDA | 1,874.2 | 117.4 | -237.8 | -121.2 | -597.9 | -34.0 | -35.5 | -37.1 | -38.7 | -40.5 |
| EBITDA, % | 630.9 | 24.51 | -182.22 | -53.39 | -474.09 | -25.77 | -25.77 | -25.77 | -25.77 | -25.77 |
| Depreciation | 24.4 | 15.1 | 14.9 | 27.6 | 15.2 | 12.4 | 12.9 | 13.5 | 14.1 | 14.7 |
| Depreciation, % | 8.2 | 3.15 | 11.38 | 12.17 | 12.03 | 9.39 | 9.39 | 9.39 | 9.39 | 9.39 |
| EBIT | 1,849.8 | 102.3 | -252.6 | -148.8 | -613.1 | -38.0 | -39.7 | -41.5 | -43.4 | -45.3 |
| EBIT, % | 622.7 | 21.36 | -193.6 | -65.55 | -486.12 | -28.84 | -28.84 | -28.84 | -28.84 | -28.84 |
| Total Cash | 462.3 | 551.3 | 284.7 | 242.1 | 136.5 | 131.8 | 137.7 | 143.9 | 150.3 | 157.1 |
| Total Cash, percent | .0 | .0 | .0 | .0 | .0 | .0 | .0 | .0 | .0 | .0 |
| Account Receivables | 132.8 | 120.6 | 119.4 | 76.8 | 39.8 | 59.8 | 62.5 | 65.3 | 68.2 | 71.2 |
| Account Receivables, % | 44.72 | 25.18 | 91.53 | 33.83 | 31.52 | 45.36 | 45.36 | 45.36 | 45.36 | 45.36 |
| Inventories | 92.8 | 9.2 | 23.8 | 21.9 | 10.3 | 18.2 | 19.1 | 19.9 | 20.8 | 21.8 |
| Inventories, % | 31.23 | 1.92 | 18.23 | 9.66 | 8.2 | 13.85 | 13.85 | 13.85 | 13.85 | 13.85 |
| Accounts Payable | 78.3 | 27.2 | 71.7 | 72.0 | 38.5 | 39.3 | 41.1 | 43.0 | 44.9 | 46.9 |
| Accounts Payable, % | 26.35 | 5.68 | 54.97 | 31.74 | 30.53 | 29.85 | 29.85 | 29.85 | 29.85 | 29.85 |
| Capital Expenditure | -13.8 | -29.9 | -20.2 | -7.4 | -7.3 | -9.3 | -9.8 | -10.2 | -10.6 | -11.1 |
| Capital Expenditure, % | -4.65 | -6.25 | -15.5 | -3.24 | -5.77 | -7.08 | -7.08 | -7.08 | -7.08 | -7.08 |
| Tax Rate, % | 33.72 | 33.72 | 33.72 | 33.72 | 33.72 | 33.72 | 33.72 | 33.72 | 33.72 | 33.72 |
| EBITAT | 1,200.3 | 102.1 | -191.5 | -99.8 | -406.3 | -28.4 | -29.7 | -31.0 | -32.4 | -33.9 |
| Depreciation | ||||||||||
| Changes in Account Receivables | ||||||||||
| Changes in Inventories | ||||||||||
| Changes in Accounts Payable | ||||||||||
| Capital Expenditure | ||||||||||
| UFCF | 1,063.5 | 132.0 | -165.7 | -34.7 | -383.3 | -52.5 | -28.3 | -29.5 | -30.8 | -32.2 |
| WACC, % | 10.05 | 10.12 | 10.07 | 10.05 | 10.05 | 10.07 | 10.07 | 10.07 | 10.07 | 10.07 |
| PV UFCF | ||||||||||
| SUM PV UFCF | -134.1 | |||||||||
| Long Term Growth Rate, % | 2.00 | |||||||||
| Free cash flow (T + 1) | -33 | |||||||||
| Terminal Value | -407 | |||||||||
| Present Terminal Value | -252 | |||||||||
| Enterprise Value | -386 | |||||||||
| Net Debt | 57 | |||||||||
| Equity Value | -443 | |||||||||
| Diluted Shares Outstanding, MM | 9,755 | |||||||||
| Equity Value Per Share | -0.05 |
What You Will Receive
- Customizable Excel Template: A fully adaptable Excel-based DCF Calculator featuring pre-filled financial data for Honbridge Holdings Limited (8137HK).
- Current Market Data: Access to historical figures and forward-looking projections (highlighted in the yellow cells).
- Versatile Forecasting: Adjust assumptions related to revenue growth, EBITDA percentages, and WACC.
- Real-Time Calculations: Instantly observe how your inputs affect the valuation of Honbridge Holdings Limited (8137HK).
- Professional-Grade Tool: Designed for investors, CFOs, consultants, and financial analysts.
- Intuitive Layout: Organized for simplicity and ease of navigation, complemented by step-by-step guidance.
Key Features
- Pre-Loaded Data: Honbridge Holdings Limited’s historical financial reports and pre-filled projections.
- Fully Adjustable Inputs: Modify WACC, tax rates, revenue growth, and EBITDA margins as needed.
- Instant Results: View Honbridge Holdings Limited’s intrinsic value recalculating in real time.
- Clear Visual Outputs: Dashboard charts illustrate valuation results and essential metrics.
- Built for Accuracy: A professional-grade tool designed for analysts, investors, and finance specialists.
How It Functions
- Download the Template: Gain immediate access to the Excel-based Honbridge Holdings Limited (8137HK) DCF Calculator.
- Input Your Assumptions: Modify the yellow-highlighted cells to enter growth rates, WACC, margins, and other parameters.
- Instant Calculations: The model automatically recalculates the intrinsic value of Honbridge Holdings Limited (8137HK).
- Test Scenarios: Explore various assumptions to assess potential fluctuations in valuation.
- Analyze and Decide: Leverage the results to inform your investment or financial analysis.
Why Opt for This Calculator?
- All-in-One Utility: Incorporates DCF, WACC, and key financial ratio analyses for a comprehensive experience.
- Flexible Inputs: Modify the yellow-highlighted fields to explore various scenarios.
- In-Depth Analysis: Automatically determines Honbridge Holdings Limited's intrinsic value and Net Present Value.
- Built-In Data: Historical and projected data provide reliable starting points for your calculations.
- High-Quality Standards: Perfect for financial analysts, investors, and business consultants alike.
Who Can Benefit from This Product?
- Finance Students: Master valuation techniques and apply them using real-world data.
- Academics: Integrate industry-standard models into your coursework or research endeavors.
- Investors: Evaluate your own hypotheses and assess valuation results for Honbridge Holdings Limited (8137HK).
- Analysts: Optimize your workflow with a customizable DCF model that’s ready to use.
- Small Business Owners: Discover how large public companies like Honbridge Holdings Limited (8137HK) are evaluated.
Contents of the Template
- Preloaded 8137HK Data: Historical and projected financial information, encompassing revenue, EBIT, and capital expenditures.
- DCF and WACC Models: Advanced sheets designed for calculating intrinsic value and Weighted Average Cost of Capital.
- Editable Inputs: Cells highlighted in yellow for modifying revenue growth, tax rates, and discount rates.
- Financial Statements: Detailed annual and quarterly financial data for in-depth analysis.
- Key Ratios: Metrics on profitability, leverage, and efficiency to assess company performance.
- Dashboard and Charts: Visual representations of valuation results and underlying assumptions.
Disclaimer
All information, articles, and product details provided on this website are for general informational and educational purposes only. We do not claim any ownership over, nor do we intend to infringe upon, any trademarks, copyrights, logos, brand names, or other intellectual property mentioned or depicted on this site. Such intellectual property remains the property of its respective owners, and any references here are made solely for identification or informational purposes, without implying any affiliation, endorsement, or partnership.
We make no representations or warranties, express or implied, regarding the accuracy, completeness, or suitability of any content or products presented. Nothing on this website should be construed as legal, tax, investment, financial, medical, or other professional advice. In addition, no part of this site—including articles or product references—constitutes a solicitation, recommendation, endorsement, advertisement, or offer to buy or sell any securities, franchises, or other financial instruments, particularly in jurisdictions where such activity would be unlawful.
All content is of a general nature and may not address the specific circumstances of any individual or entity. It is not a substitute for professional advice or services. Any actions you take based on the information provided here are strictly at your own risk. You accept full responsibility for any decisions or outcomes arising from your use of this website and agree to release us from any liability in connection with your use of, or reliance upon, the content or products found herein.