
|
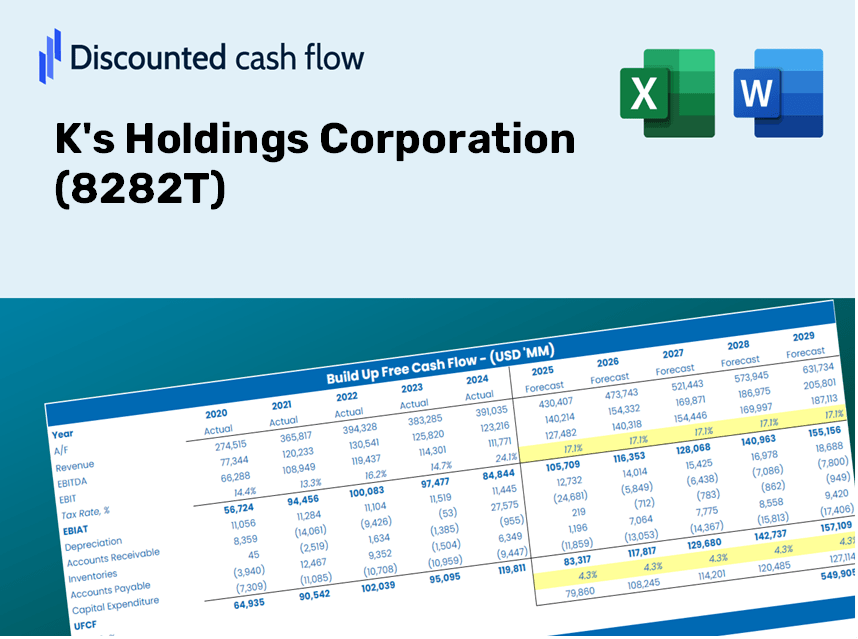
K's Holdings Corporation (8282.T) DCF -Bewertung |
Fully Editable: Tailor To Your Needs In Excel Or Sheets
Professional Design: Trusted, Industry-Standard Templates
Investor-Approved Valuation Models
MAC/PC Compatible, Fully Unlocked
No Expertise Is Needed; Easy To Follow
K's Holdings Corporation (8282.T) Bundle
Entdecken Sie das wahre Potenzial der Holdings Corporation (8282T) von K mit unserem Premium -DCF -Taschenrechner! Passen Sie die wichtigsten Annahmen an, erkunden Sie verschiedene Szenarien und bewerten Sie die Auswirkungen von Änderungen auf die Bewertung der Holdings Corporation (8282T)-alles innerhalb einer benutzerfreundlichen Excel-Vorlage.
Discounted Cash Flow (DCF) - (USD MM)
| Year | AY1 2020 |
AY2 2021 |
AY3 2022 |
AY4 2023 |
AY5 2024 |
FY1 2025 |
FY2 2026 |
FY3 2027 |
FY4 2028 |
FY5 2029 |
|---|---|---|---|---|---|---|---|---|---|---|
| Revenue | 792,542.0 | 747,219.0 | 737,320.0 | 718,369.0 | 738,019.0 | 725,328.1 | 712,855.4 | 700,597.3 | 688,549.9 | 676,709.6 |
| Revenue Growth, % | 0 | -5.72 | -1.32 | -2.57 | 2.74 | -1.72 | -1.72 | -1.72 | -1.72 | -1.72 |
| EBITDA | 65,989.0 | 56,582.0 | 46,656.0 | 30,068.0 | 29,480.0 | 44,109.3 | 43,350.8 | 42,605.3 | 41,872.7 | 41,152.7 |
| EBITDA, % | 8.33 | 7.57 | 6.33 | 4.19 | 3.99 | 6.08 | 6.08 | 6.08 | 6.08 | 6.08 |
| Depreciation | 14,251.0 | 14,347.0 | 14,932.0 | 15,155.0 | 14,540.0 | 14,250.0 | 14,005.0 | 13,764.1 | 13,527.4 | 13,294.8 |
| Depreciation, % | 1.8 | 1.92 | 2.03 | 2.11 | 1.97 | 1.96 | 1.96 | 1.96 | 1.96 | 1.96 |
| EBIT | 51,738.0 | 42,235.0 | 31,724.0 | 14,913.0 | 14,940.0 | 29,859.3 | 29,345.8 | 28,841.2 | 28,345.3 | 27,857.8 |
| EBIT, % | 6.53 | 5.65 | 4.3 | 2.08 | 2.02 | 4.12 | 4.12 | 4.12 | 4.12 | 4.12 |
| Total Cash | 27,995.0 | 29,938.0 | 10,689.0 | 16,295.0 | 15,833.0 | 19,442.1 | 19,107.8 | 18,779.2 | 18,456.3 | 18,138.9 |
| Total Cash, percent | .0 | .0 | .0 | .0 | .0 | .0 | .0 | .0 | .0 | .0 |
| Account Receivables | 25,460.0 | 28,345.0 | 24,700.0 | 32,148.0 | 33,137.0 | 28,028.1 | 27,546.1 | 27,072.4 | 26,606.9 | 26,149.3 |
| Account Receivables, % | 3.21 | 3.79 | 3.35 | 4.48 | 4.49 | 3.86 | 3.86 | 3.86 | 3.86 | 3.86 |
| Inventories | 143,454.0 | 156,903.0 | 187,242.0 | 171,255.0 | 168,587.0 | 161,278.6 | 158,505.3 | 155,779.6 | 153,100.8 | 150,468.1 |
| Inventories, % | 18.1 | 21 | 25.39 | 23.84 | 22.84 | 22.24 | 22.24 | 22.24 | 22.24 | 22.24 |
| Accounts Payable | 47,799.0 | 52,687.0 | 44,374.0 | 41,708.0 | 44,648.0 | 44,906.7 | 44,134.4 | 43,375.5 | 42,629.6 | 41,896.6 |
| Accounts Payable, % | 6.03 | 7.05 | 6.02 | 5.81 | 6.05 | 6.19 | 6.19 | 6.19 | 6.19 | 6.19 |
| Capital Expenditure | -19,791.0 | -9,074.0 | -19,415.0 | -17,461.0 | -10,839.0 | -14,860.5 | -14,605.0 | -14,353.9 | -14,107.0 | -13,864.4 |
| Capital Expenditure, % | -2.5 | -1.21 | -2.63 | -2.43 | -1.47 | -2.05 | -2.05 | -2.05 | -2.05 | -2.05 |
| Tax Rate, % | 33.82 | 33.82 | 33.82 | 33.82 | 33.82 | 33.82 | 33.82 | 33.82 | 33.82 | 33.82 |
| EBITAT | 36,569.7 | 28,843.4 | 21,415.7 | 7,621.7 | 9,887.7 | 19,335.2 | 19,002.7 | 18,675.9 | 18,354.8 | 18,039.2 |
| Depreciation | ||||||||||
| Changes in Account Receivables | ||||||||||
| Changes in Inventories | ||||||||||
| Changes in Accounts Payable | ||||||||||
| Capital Expenditure | ||||||||||
| UFCF | -90,085.3 | 22,670.4 | -18,074.3 | 11,188.7 | 18,207.7 | 31,400.7 | 20,885.8 | 20,526.6 | 20,173.6 | 19,826.7 |
| WACC, % | 4.26 | 4.24 | 4.24 | 4.11 | 4.23 | 4.22 | 4.22 | 4.22 | 4.22 | 4.22 |
| PV UFCF | ||||||||||
| SUM PV UFCF | 100,724.5 | |||||||||
| Long Term Growth Rate, % | 1.00 | |||||||||
| Free cash flow (T + 1) | 20,025 | |||||||||
| Terminal Value | 622,609 | |||||||||
| Present Terminal Value | 506,450 | |||||||||
| Enterprise Value | 607,175 | |||||||||
| Net Debt | 51,075 | |||||||||
| Equity Value | 556,100 | |||||||||
| Diluted Shares Outstanding, MM | 167 | |||||||||
| Equity Value Per Share | 3,328.34 |
What You Will Receive
- Authentic K's Holdings Financials: Access to both historical and projected data for precise valuations.
- Customizable Inputs: Adjust WACC, tax rates, revenue growth, and capital expenditures as needed.
- Instant Calculations: Dynamic computations for intrinsic value and NPV at your fingertips.
- Scenario Analysis: Explore various scenarios to assess K's Holdings' future outlook.
- User-Friendly and Sleek Design: Designed for industry professionals while remaining easy for novices to navigate.
Key Features
- Real-Life K's Holdings Data: Pre-populated with K's Holdings Corporation’s historical financial metrics and future projections.
- Fully Customizable Inputs: Modify revenue growth rates, profit margins, weighted average cost of capital (WACC), tax percentages, and capital expenditure forecasts.
- Dynamic Valuation Model: Instant updates to Net Present Value (NPV) and intrinsic value based on your modifications.
- Scenario Testing: Develop various forecast scenarios to evaluate different valuation results.
- User-Friendly Design: Intuitive, organized, and tailored for both seasoned professionals and newcomers.
How It Functions
- Download the Template: Gain immediate access to the Excel-based K's Holdings Corporation DCF Calculator.
- Input Your Assumptions: Modify the yellow-highlighted cells for growth rates, WACC, margins, and more.
- Instant Calculations: The model automatically recalculates the intrinsic value of K's Holdings Corporation (8282T).
- Test Scenarios: Experiment with different assumptions to see how valuations may vary.
- Analyze and Decide: Utilize the outcomes to inform your investment or financial decisions.
Why Opt for K's Holdings Corporation (8282T) Calculator?
- Reliable Data: Utilize authentic K's Holdings financials for trustworthy valuation outcomes.
- Tailorable: Modify essential metrics such as growth rates, WACC, and tax rates to align with your forecasts.
- Efficient: Pre-configured calculations save you the hassle of starting from the ground up.
- Professional-Quality Tool: Crafted for investors, analysts, and industry consultants.
- User-Centric: Featuring an easy-to-navigate layout and clear, step-by-step guidance suitable for all users.
Who Can Benefit from K's Holdings Corporation (8282T)?
- Individual Investors: Gain insights for making informed decisions on buying or selling shares of K's Holdings Corporation (8282T).
- Financial Analysts: Enhance valuation efforts with comprehensive financial models tailored for K's Holdings Corporation (8282T).
- Consultants: Provide clients with precise and timely valuation insights regarding K's Holdings Corporation (8282T).
- Business Owners: Learn how established companies like K's Holdings Corporation (8282T) are valued to inform your strategic planning.
- Finance Students: Master valuation methodologies using practical examples and data from K's Holdings Corporation (8282T).
Contents of the Template
- Pre-Filled Data: Contains K's Holdings Corporation's historical financial performance and projections.
- Discounted Cash Flow Model: Editable DCF valuation model with real-time calculations.
- Weighted Average Cost of Capital (WACC): A dedicated section for computing WACC using customized inputs.
- Key Financial Ratios: Evaluate K's Holdings Corporation's profitability, efficiency, and financial leverage.
- Customizable Inputs: Easily adjust revenue growth rates, profit margins, and tax rates.
- Intuitive Dashboard: Visuals and tables highlighting essential valuation outcomes.
Disclaimer
All information, articles, and product details provided on this website are for general informational and educational purposes only. We do not claim any ownership over, nor do we intend to infringe upon, any trademarks, copyrights, logos, brand names, or other intellectual property mentioned or depicted on this site. Such intellectual property remains the property of its respective owners, and any references here are made solely for identification or informational purposes, without implying any affiliation, endorsement, or partnership.
We make no representations or warranties, express or implied, regarding the accuracy, completeness, or suitability of any content or products presented. Nothing on this website should be construed as legal, tax, investment, financial, medical, or other professional advice. In addition, no part of this site—including articles or product references—constitutes a solicitation, recommendation, endorsement, advertisement, or offer to buy or sell any securities, franchises, or other financial instruments, particularly in jurisdictions where such activity would be unlawful.
All content is of a general nature and may not address the specific circumstances of any individual or entity. It is not a substitute for professional advice or services. Any actions you take based on the information provided here are strictly at your own risk. You accept full responsibility for any decisions or outcomes arising from your use of this website and agree to release us from any liability in connection with your use of, or reliance upon, the content or products found herein.