
|
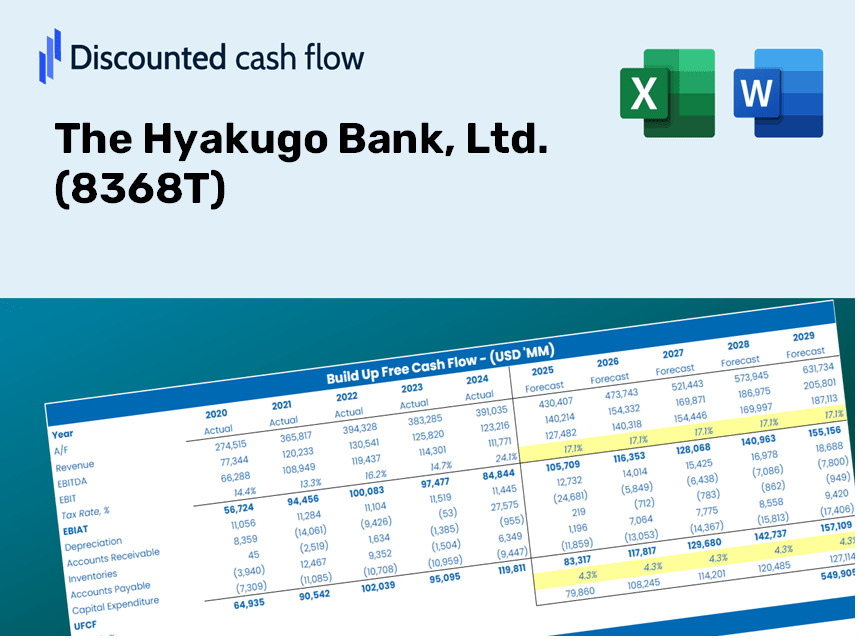
Die Hyakugo Bank, Ltd. (8368.t) DCF -Bewertung |
Fully Editable: Tailor To Your Needs In Excel Or Sheets
Professional Design: Trusted, Industry-Standard Templates
Investor-Approved Valuation Models
MAC/PC Compatible, Fully Unlocked
No Expertise Is Needed; Easy To Follow
The Hyakugo Bank, Ltd. (8368.T) Bundle
Entdecken Sie die finanzielle Zukunft der Hyakugo Bank, Ltd. (8368t) mit unserem benutzerfreundlichen DCF-Taschenrechner! Geben Sie Ihre Annahmen für Wachstum, Margen und Kosten für die Berechnung der Hyakugo Bank, Ltd. (8368T) ein und verbessern Sie Ihre Anlagestrategie.
Discounted Cash Flow (DCF) - (USD MM)
| Year | AY1 2021 |
AY2 2022 |
AY3 2023 |
AY4 2024 |
AY5 2025 |
FY1 2026 |
FY2 2027 |
FY3 2028 |
FY4 2029 |
FY5 2030 |
|---|---|---|---|---|---|---|---|---|---|---|
| Revenue | 89,032.0 | 90,900.0 | 97,886.0 | 113,971.0 | 118,686.0 | 127,692.2 | 137,381.7 | 147,806.6 | 159,022.4 | 171,089.4 |
| Revenue Growth, % | 0 | 2.1 | 7.69 | 16.43 | 4.14 | 7.59 | 7.59 | 7.59 | 7.59 | 7.59 |
| EBITDA | 22,511.0 | 23,157.0 | 24,397.0 | 23,637.0 | 22,285.0 | 29,420.1 | 31,652.5 | 34,054.4 | 36,638.5 | 39,418.7 |
| EBITDA, % | 25.28 | 25.48 | 24.92 | 20.74 | 18.78 | 23.04 | 23.04 | 23.04 | 23.04 | 23.04 |
| Depreciation | 4,243.0 | 4,249.0 | 3,937.0 | 3,756.0 | 3,854.0 | 5,108.9 | 5,496.6 | 5,913.7 | 6,362.5 | 6,845.3 |
| Depreciation, % | 4.77 | 4.67 | 4.02 | 3.3 | 3.25 | 4 | 4 | 4 | 4 | 4 |
| EBIT | 18,268.0 | 18,908.0 | 20,460.0 | 19,881.0 | 18,431.0 | 24,311.1 | 26,155.9 | 28,140.7 | 30,276.1 | 32,573.5 |
| EBIT, % | 20.52 | 20.8 | 20.9 | 17.44 | 15.53 | 19.04 | 19.04 | 19.04 | 19.04 | 19.04 |
| Total Cash | 1,569,749.0 | 1,872,987.0 | 1,351,152.0 | 1,411,071.0 | 665,527.0 | 127,692.2 | 137,381.7 | 147,806.6 | 159,022.4 | 171,089.4 |
| Total Cash, percent | .0 | .0 | .0 | .0 | .0 | .0 | .0 | .0 | .0 | .0 |
| Account Receivables | .0 | .0 | .0 | .0 | .0 | .0 | .0 | .0 | .0 | .0 |
| Account Receivables, % | 0 | 0 | 0 | 0 | 0 | 0 | 0 | 0 | 0 | 0 |
| Inventories | .0 | .0 | .0 | .0 | .0 | .0 | .0 | .0 | .0 | .0 |
| Inventories, % | 0 | 0 | 0 | 0 | 0 | 0 | 0 | 0 | 0 | 0 |
| Accounts Payable | .0 | .0 | .0 | .0 | .0 | .0 | .0 | .0 | .0 | .0 |
| Accounts Payable, % | 0 | 0 | 0 | 0 | 0 | 0 | 0 | 0 | 0 | 0 |
| Capital Expenditure | -3,147.0 | -2,949.0 | -2,836.0 | -3,298.0 | -4,198.0 | -4,113.5 | -4,425.6 | -4,761.4 | -5,122.7 | -5,511.5 |
| Capital Expenditure, % | -3.53 | -3.24 | -2.9 | -2.89 | -3.54 | -3.22 | -3.22 | -3.22 | -3.22 | -3.22 |
| Tax Rate, % | 29.09 | 29.09 | 29.09 | 29.09 | 29.09 | 29.09 | 29.09 | 29.09 | 29.09 | 29.09 |
| EBITAT | 12,967.1 | 13,402.0 | 14,494.4 | 14,281.0 | 13,069.2 | 17,282.6 | 18,594.1 | 20,005.0 | 21,523.1 | 23,156.3 |
| Depreciation | ||||||||||
| Changes in Account Receivables | ||||||||||
| Changes in Inventories | ||||||||||
| Changes in Accounts Payable | ||||||||||
| Capital Expenditure | ||||||||||
| UFCF | 14,063.1 | 14,702.0 | 15,595.4 | 14,739.0 | 12,725.2 | 18,278.1 | 19,665.1 | 21,157.3 | 22,762.8 | 24,490.1 |
| WACC, % | 3.13 | 3.12 | 3.12 | 3.15 | 3.12 | 3.13 | 3.13 | 3.13 | 3.13 | 3.13 |
| PV UFCF | ||||||||||
| SUM PV UFCF | 96,619.8 | |||||||||
| Long Term Growth Rate, % | 2.00 | |||||||||
| Free cash flow (T + 1) | 24,980 | |||||||||
| Terminal Value | 2,212,591 | |||||||||
| Present Terminal Value | 1,896,695 | |||||||||
| Enterprise Value | 1,993,315 | |||||||||
| Net Debt | 703,601 | |||||||||
| Equity Value | 1,289,714 | |||||||||
| Diluted Shares Outstanding, MM | 246 | |||||||||
| Equity Value Per Share | 5,244.51 |
What You Will Receive
- Adjustable Forecast Parameters: Easily modify assumptions (growth %, margins, WACC) to explore various scenarios.
- Relevant Financial Data: The Hyakugo Bank’s financial information pre-populated to enhance your analysis.
- Instant DCF Calculations: The template automatically computes Net Present Value (NPV) and intrinsic value for you.
- Custom and Professional Design: A sleek Excel model tailored to fit your valuation requirements.
- Designed for Analysts and Investors: Perfect for evaluating projections, validating strategies, and increasing efficiency.
Key Benefits
- Customizable Forecast Inputs: Adjust essential factors such as revenue growth, EBITDA percentage, and capital expenditures to fit your analysis.
- Instant DCF Valuation: Quickly calculates intrinsic value, NPV, and other key metrics at the click of a button.
- High-Precision Accuracy: Leverages The Hyakugo Bank, Ltd.'s (8368T) real financial data for credible valuation results.
- Simplified Scenario Analysis: Effortlessly explore different assumptions and evaluate various outcomes.
- Efficiency Booster: Say goodbye to the hassle of constructing intricate valuation models from the ground up.
How It Works
- Download: Obtain the pre-formatted Excel file featuring The Hyakugo Bank, Ltd.'s (8368T) financial data.
- Customize: Tailor your forecasts, such as revenue growth, EBITDA %, and WACC.
- Update Automatically: Enjoy real-time updates for intrinsic value and NPV calculations.
- Test Scenarios: Generate various projections and instantly compare results.
- Make Decisions: Leverage the valuation findings to inform your investment strategy.
Why Opt for The Hyakugo Bank, Ltd. (8368T) Calculator?
- Time-Efficient: Eliminate the hassle of building a DCF model from the ground up—it's ready for immediate use.
- Enhanced Precision: Dependable financial data and formulas minimize valuation errors.
- Completely Customizable: Adjust the model to align with your specific assumptions and forecasts.
- User-Friendly: Intuitive charts and outputs simplify the analysis of results.
- Endorsed by Professionals: Crafted for experts who prioritize accuracy and ease of use.
Who Should Utilize This Product?
- Investors: Precisely assess The Hyakugo Bank's fair value before making investment choices.
- CFOs: Utilize a high-quality DCF model for financial analysis and reporting.
- Consultants: Effortlessly modify the template for client valuation reports.
- Entrepreneurs: Acquire knowledge on financial modeling practices employed by leading companies.
- Educators: Employ it as an instructional resource to illustrate valuation techniques.
Contents of the Template
- Pre-Filled DCF Model: The Hyakugo Bank’s (8368T) financial data preloaded for immediate use.
- WACC Calculator: Comprehensive calculations for the Weighted Average Cost of Capital.
- Financial Ratios: Analyze The Hyakugo Bank’s (8368T) profitability, leverage, and efficiency.
- Editable Inputs: Adjust assumptions such as growth rates, margins, and CAPEX to suit your scenarios.
- Financial Statements: Access annual and quarterly reports for in-depth analysis.
- Interactive Dashboard: Effortlessly visualize key valuation metrics and outcomes.
Disclaimer
All information, articles, and product details provided on this website are for general informational and educational purposes only. We do not claim any ownership over, nor do we intend to infringe upon, any trademarks, copyrights, logos, brand names, or other intellectual property mentioned or depicted on this site. Such intellectual property remains the property of its respective owners, and any references here are made solely for identification or informational purposes, without implying any affiliation, endorsement, or partnership.
We make no representations or warranties, express or implied, regarding the accuracy, completeness, or suitability of any content or products presented. Nothing on this website should be construed as legal, tax, investment, financial, medical, or other professional advice. In addition, no part of this site—including articles or product references—constitutes a solicitation, recommendation, endorsement, advertisement, or offer to buy or sell any securities, franchises, or other financial instruments, particularly in jurisdictions where such activity would be unlawful.
All content is of a general nature and may not address the specific circumstances of any individual or entity. It is not a substitute for professional advice or services. Any actions you take based on the information provided here are strictly at your own risk. You accept full responsibility for any decisions or outcomes arising from your use of this website and agree to release us from any liability in connection with your use of, or reliance upon, the content or products found herein.