
|
SBI Holdings, Inc. (8473.t) DCF -Bewertung |
Fully Editable: Tailor To Your Needs In Excel Or Sheets
Professional Design: Trusted, Industry-Standard Templates
Investor-Approved Valuation Models
MAC/PC Compatible, Fully Unlocked
No Expertise Is Needed; Easy To Follow
SBI Holdings, Inc. (8473.T) Bundle
Stürzen Sie Ihre Analyse und verbessern Sie die Präzision mit unserem (8473T) DCF -Taschenrechner! In diesem Tool können Sie SBI Holdings, Inc. Daten und anpassbare Annahmen ausgestattet und können SBI Holdings, Inc. wie ein erfahrener Investor prognostizieren, analysieren und bewerten.
Discounted Cash Flow (DCF) - (USD MM)
| Year | AY1 2021 |
AY2 2022 |
AY3 2023 |
AY4 2024 |
AY5 2025 |
FY1 2026 |
FY2 2027 |
FY3 2028 |
FY4 2029 |
FY5 2030 |
|---|---|---|---|---|---|---|---|---|---|---|
| Revenue | 541,145.0 | 763,618.0 | 998,559.0 | 1,210,504.0 | 1,443,733.0 | 1,849,315.6 | 2,368,837.1 | 3,034,305.9 | 3,886,722.4 | 4,978,605.1 |
| Revenue Growth, % | 0 | 41.11 | 30.77 | 21.23 | 19.27 | 28.09 | 28.09 | 28.09 | 28.09 | 28.09 |
| EBITDA | 169,828.0 | 203,326.0 | 171,815.0 | 469,412.0 | 402,557.0 | 524,752.0 | 672,168.6 | 860,998.5 | 1,102,875.6 | 1,412,702.5 |
| EBITDA, % | 31.38 | 26.63 | 17.21 | 38.78 | 27.88 | 28.38 | 28.38 | 28.38 | 28.38 | 28.38 |
| Depreciation | 24,291.0 | 32,207.0 | 56,129.0 | 55,432.0 | 60,794.0 | 85,503.6 | 109,523.8 | 140,292.0 | 179,703.7 | 230,187.2 |
| Depreciation, % | 4.49 | 4.22 | 5.62 | 4.58 | 4.21 | 4.62 | 4.62 | 4.62 | 4.62 | 4.62 |
| EBIT | 145,537.0 | 171,119.0 | 115,686.0 | 413,980.0 | 341,763.0 | 439,248.3 | 562,644.8 | 720,706.5 | 923,171.9 | 1,182,515.3 |
| EBIT, % | 26.89 | 22.41 | 11.59 | 34.2 | 23.67 | 23.75 | 23.75 | 23.75 | 23.75 | 23.75 |
| Total Cash | 3,095,445.0 | 4,860,990.0 | 3,782,280.0 | 4,580,335.0 | 6,256,162.0 | 1,849,315.6 | 2,368,837.1 | 3,034,305.9 | 3,886,722.4 | 4,978,605.1 |
| Total Cash, percent | .0 | .0 | .0 | .0 | .0 | .0 | .0 | .0 | .0 | .0 |
| Account Receivables | 1,183,896.0 | 8,399,588.0 | 10,484,222.0 | 11,606,228.0 | 13,654,337.0 | 1,849,315.6 | 2,368,837.1 | 3,034,305.9 | 3,886,722.4 | 4,978,605.1 |
| Account Receivables, % | 218.78 | 1099.97 | 1049.94 | 958.79 | 945.77 | 100 | 100 | 100 | 100 | 100 |
| Inventories | .0 | 208,121.0 | -101,872.0 | 240,398.0 | .0 | 136,524.0 | 174,877.2 | 224,004.8 | 286,933.6 | 367,540.8 |
| Inventories, % | 0 | 27.25 | -10.2 | 19.86 | 0 | 7.38 | 7.38 | 7.38 | 7.38 | 7.38 |
| Accounts Payable | 189,729.0 | 487,846.0 | 482,677.0 | 656,571.0 | 749,758.0 | 937,438.5 | 1,200,789.7 | 1,538,123.2 | 1,970,222.5 | 2,523,709.9 |
| Accounts Payable, % | 35.06 | 63.89 | 48.34 | 54.24 | 51.93 | 50.69 | 50.69 | 50.69 | 50.69 | 50.69 |
| Capital Expenditure | -15,419.0 | -25,965.0 | -37,568.0 | -43,480.0 | -1,667,362.0 | -420,178.2 | -538,217.3 | -689,416.8 | -883,092.1 | -1,131,175.9 |
| Capital Expenditure, % | -2.85 | -3.4 | -3.76 | -3.59 | -115.49 | -22.72 | -22.72 | -22.72 | -22.72 | -22.72 |
| Tax Rate, % | 35.87 | 35.87 | 35.87 | 35.87 | 35.87 | 35.87 | 35.87 | 35.87 | 35.87 | 35.87 |
| EBITAT | 84,077.2 | 152,100.9 | 40,145.8 | 255,118.4 | 219,157.9 | 269,795.3 | 345,587.9 | 442,672.6 | 567,031.1 | 726,325.0 |
| Depreciation | ||||||||||
| Changes in Account Receivables | ||||||||||
| Changes in Inventories | ||||||||||
| Changes in Accounts Payable | ||||||||||
| Capital Expenditure | ||||||||||
| UFCF | -901,217.8 | -6,967,353.1 | -1,721,103.2 | -1,023,311.6 | -3,101,934.1 | 11,791,298.6 | -377,629.1 | -483,715.0 | -619,603.3 | -793,666.3 |
| WACC, % | 2.91 | 3.76 | 2.28 | 3.02 | 3.08 | 3.01 | 3.01 | 3.01 | 3.01 | 3.01 |
| PV UFCF | ||||||||||
| SUM PV UFCF | 9,413,710.1 | |||||||||
| Long Term Growth Rate, % | 2.00 | |||||||||
| Free cash flow (T + 1) | -809,540 | |||||||||
| Terminal Value | -80,081,537 | |||||||||
| Present Terminal Value | -69,042,517 | |||||||||
| Enterprise Value | -59,628,806 | |||||||||
| Net Debt | 220,840 | |||||||||
| Equity Value | -59,849,646 | |||||||||
| Diluted Shares Outstanding, MM | 318 | |||||||||
| Equity Value Per Share | -188,359.26 |
What You Will Receive
- Customizable Excel Template: An Excel-based DCF Calculator tailored for SBI Holdings, Inc. (8473T) with pre-filled financial data.
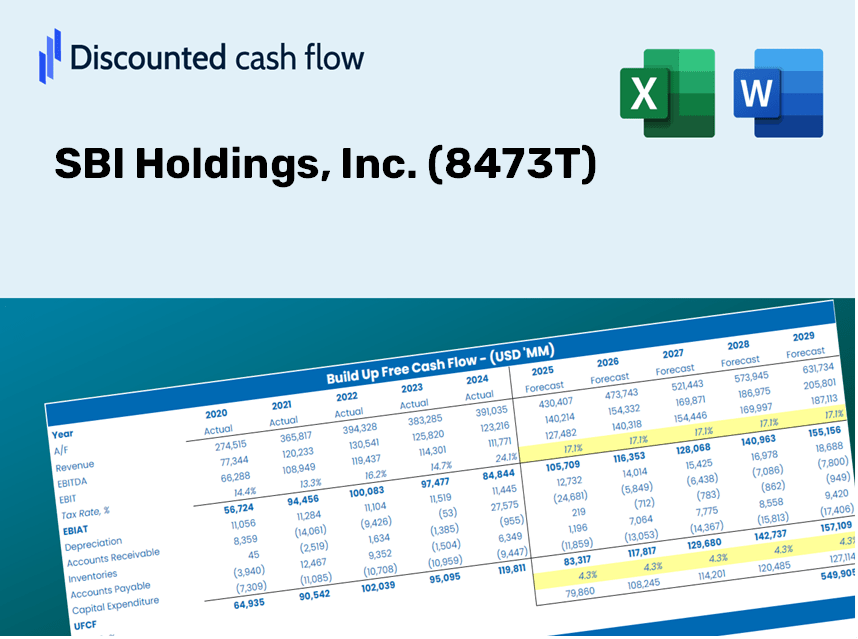
- Authentic Data: Access to both historical performance and forward-looking projections (highlighted in the yellow cells).
- Assumption Flexibility: Modify key forecast variables such as revenue growth, EBITDA margin, and WACC.
- Instant Calculations: Quickly observe how changes in your inputs affect SBI Holdings' valuation.
- Professional Resource: Designed specifically for investors, CFOs, consultants, and financial analysts.
- Intuitive Layout: Organized for simplicity and ease of navigation, complete with detailed instructions.
Key Features
- Pre-Loaded Data: SBI Holdings, Inc.'s historical financial statements and pre-populated forecasts.
- Fully Adjustable Inputs: Modify WACC, tax rates, revenue growth, and EBITDA margins at your convenience.
- Instant Results: Observe SBI Holdings, Inc.'s intrinsic value updating in real time.
- Clear Visual Outputs: Interactive dashboard charts illustrate valuation results and essential metrics.
- Built for Accuracy: Designed as a professional tool for analysts, investors, and finance professionals.
How It Works
- Download the Template: Gain immediate access to the Excel-based SBI Holdings, Inc. (8473T) DCF Calculator.
- Input Your Assumptions: Modify the yellow-highlighted cells for growth rates, WACC, profit margins, and other key variables.
- Instant Calculations: The model automatically recalculates the intrinsic value of SBI Holdings, Inc. (8473T).
- Test Scenarios: Experiment with various assumptions to analyze potential changes in valuation.
- Analyze and Decide: Utilize the results to inform your investment strategies or financial assessments.
Why Opt for This Calculator?
- Designed for Experts: A sophisticated tool tailored for analysts, CFOs, and consultants.
- Accurate Financial Data: SBI Holdings, Inc.'s historical and projected financial information is preloaded for precision.
- Comprehensive Scenario Analysis: Easily simulate various forecasts and assumptions.
- Clear and Concise Outputs: Automatically computes intrinsic value, NPV, and essential metrics.
- User-Friendly Interface: Step-by-step guidance simplifies the entire process.
Who Can Benefit from SBI Holdings, Inc. (8473T)?
- Investors: Evaluate the valuation of SBI Holdings, Inc. (8473T) for informed buying or selling decisions.
- CFOs and Financial Analysts: Optimize valuation methodologies and validate financial projections.
- Startup Founders: Gain insights into how established companies like SBI Holdings, Inc. (8473T) are appraised.
- Consultants: Create comprehensive valuation reports for your clients involving SBI Holdings, Inc. (8473T).
- Students and Educators: Incorporate real-time data for practicing and teaching valuation strategies.
Contents of the Template
- Historical Data: Encompasses SBI Holdings, Inc.'s past financial performance and foundational forecasts.
- DCF and Levered DCF Models: Comprehensive templates designed to determine the intrinsic value of SBI Holdings, Inc. (8473T).
- WACC Sheet: Pre-configured calculations for Weighted Average Cost of Capital.
- Editable Inputs: Customize essential drivers such as growth rates, EBITDA %, and CAPEX estimates.
- Quarterly and Annual Statements: A thorough analysis of SBI Holdings, Inc.'s financials.
- Interactive Dashboard: A dynamic tool to visualize valuation results and forecasts.
Disclaimer
All information, articles, and product details provided on this website are for general informational and educational purposes only. We do not claim any ownership over, nor do we intend to infringe upon, any trademarks, copyrights, logos, brand names, or other intellectual property mentioned or depicted on this site. Such intellectual property remains the property of its respective owners, and any references here are made solely for identification or informational purposes, without implying any affiliation, endorsement, or partnership.
We make no representations or warranties, express or implied, regarding the accuracy, completeness, or suitability of any content or products presented. Nothing on this website should be construed as legal, tax, investment, financial, medical, or other professional advice. In addition, no part of this site—including articles or product references—constitutes a solicitation, recommendation, endorsement, advertisement, or offer to buy or sell any securities, franchises, or other financial instruments, particularly in jurisdictions where such activity would be unlawful.
All content is of a general nature and may not address the specific circumstances of any individual or entity. It is not a substitute for professional advice or services. Any actions you take based on the information provided here are strictly at your own risk. You accept full responsibility for any decisions or outcomes arising from your use of this website and agree to release us from any liability in connection with your use of, or reliance upon, the content or products found herein.