
|
Tokai Tokyo Financial Holdings, Inc. (8616.t) DCF -Bewertung |
Fully Editable: Tailor To Your Needs In Excel Or Sheets
Professional Design: Trusted, Industry-Standard Templates
Investor-Approved Valuation Models
MAC/PC Compatible, Fully Unlocked
No Expertise Is Needed; Easy To Follow
Tokai Tokyo Financial Holdings, Inc. (8616.T) Bundle
Unser (8616T) DCF-Taschenrechner entwickelt für die Genauigkeit und ermöglicht es Ihnen, die Bewertung von Tokai Tokyo Financial Holdings, Inc. unter Verwendung realer Finanzdaten zu bewerten und eine vollständige Flexibilität zu bieten, um alle wesentlichen Parameter für erweiterte Projektionen zu ändern.
What You Will Receive
- Authentic (8616T) Financial Data: Pre-loaded with Tokai Tokyo Financial Holdings' historical and projected figures for accurate analysis.
- Completely Customizable Template: Easily adjust key inputs such as revenue growth, WACC, and EBITDA percentage.
- Instant Calculations: Watch Tokai Tokyo's intrinsic value refresh automatically as you make changes.
- Expert Valuation Tool: Tailored for investors, analysts, and consultants aiming for reliable DCF outcomes.
- User-Centric Design: Intuitive layout and straightforward guidance suitable for all skill levels.
Key Features
- Pre-Loaded Data: Historical financial statements and pre-filled forecasts for Tokai Tokyo Financial Holdings, Inc. (8616T).
- Fully Adjustable Inputs: Customize WACC, tax rates, revenue growth, and EBITDA margins to suit your analysis.
- Instant Results: View the recalculation of Tokai Tokyo’s intrinsic value in real time.
- Clear Visual Outputs: Interactive dashboard charts present valuation results and essential metrics.
- Built for Accuracy: A professional-grade tool designed for analysts, investors, and finance specialists.
How It Works
- Step 1: Download the Excel spreadsheet.
- Step 2: Examine the pre-filled data for Tokai Tokyo Financial Holdings, Inc. (8616T) (historical and forecasted).
- Step 3: Modify the key assumptions (yellow cells) based on your insights.
- Step 4: Observe automatic recalculations reflecting Tokai Tokyo’s intrinsic value.
- Step 5: Utilize the results for your investment decisions or reporting purposes.
Why Choose This Calculator for Tokai Tokyo Financial Holdings, Inc. (8616T)?
- Designed for Professionals: A sophisticated tool favored by analysts, CFOs, and financial consultants.
- Accurate Financial Data: Tokai Tokyo's historical and projected financials are preloaded to ensure precision.
- Flexible Scenario Analysis: Effortlessly test various forecasts and assumptions.
- Comprehensive Outputs: Automatically computes intrinsic value, NPV, and essential financial metrics.
- User-Friendly Interface: Step-by-step guidance makes the process straightforward.
Who Should Consider Using Tokai Tokyo Financial Holdings, Inc. (8616T)?
- Finance Students: Master valuation methodologies and apply them with real market data.
- Academics: Integrate industry-standard models into your lectures or research endeavors.
- Investors: Evaluate your own predictions and assess valuation metrics for Tokai Tokyo Financial Holdings, Inc. (8616T).
- Analysts: Enhance your efficiency with a customizable DCF model designed for your needs.
- Small Business Owners: Discover how major public companies like Tokai Tokyo Financial Holdings, Inc. (8616T) are evaluated.
Contents of the Template
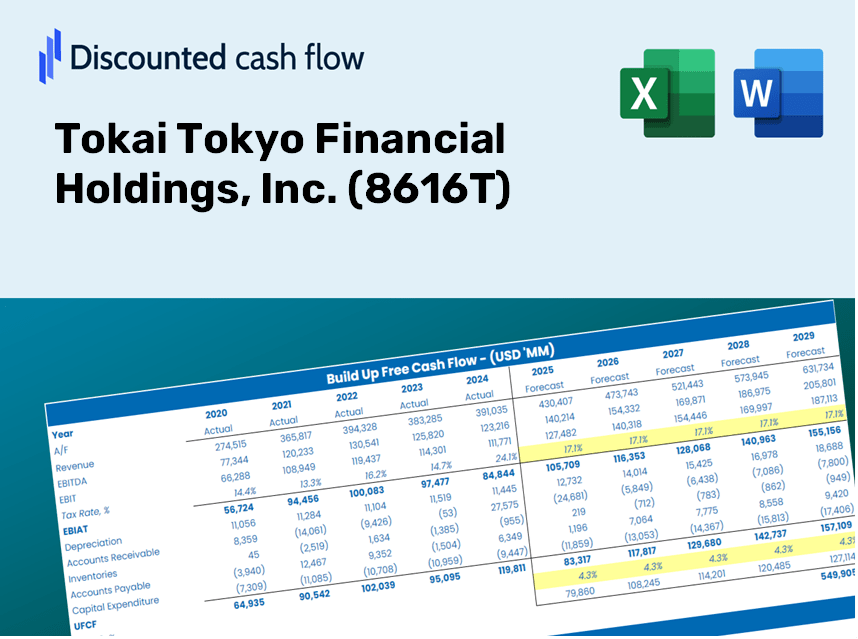
- Operating and Balance Sheet Data: Pre-filled historical data and forecasts for Tokai Tokyo Financial Holdings, Inc. (8616T), including revenue, EBITDA, EBIT, and capital expenditures.
- WACC Calculation: A specific sheet dedicated to the Weighted Average Cost of Capital (WACC), featuring parameters such as Beta, risk-free rate, and share price.
- DCF Valuation (Unlevered and Levered): Customizable Discounted Cash Flow models that present intrinsic value alongside detailed calculations.
- Financial Statements: Pre-loaded financial statements (both annual and quarterly) to facilitate thorough analysis.
- Key Ratios: A comprehensive set of profitability, leverage, and efficiency ratios for Tokai Tokyo Financial Holdings, Inc. (8616T).
- Dashboard and Charts: An interactive visual summary of valuation outputs and underlying assumptions for easy result analysis.
Disclaimer
All information, articles, and product details provided on this website are for general informational and educational purposes only. We do not claim any ownership over, nor do we intend to infringe upon, any trademarks, copyrights, logos, brand names, or other intellectual property mentioned or depicted on this site. Such intellectual property remains the property of its respective owners, and any references here are made solely for identification or informational purposes, without implying any affiliation, endorsement, or partnership.
We make no representations or warranties, express or implied, regarding the accuracy, completeness, or suitability of any content or products presented. Nothing on this website should be construed as legal, tax, investment, financial, medical, or other professional advice. In addition, no part of this site—including articles or product references—constitutes a solicitation, recommendation, endorsement, advertisement, or offer to buy or sell any securities, franchises, or other financial instruments, particularly in jurisdictions where such activity would be unlawful.
All content is of a general nature and may not address the specific circumstances of any individual or entity. It is not a substitute for professional advice or services. Any actions you take based on the information provided here are strictly at your own risk. You accept full responsibility for any decisions or outcomes arising from your use of this website and agree to release us from any liability in connection with your use of, or reliance upon, the content or products found herein.