
|
DAI-IHISI Life Holdings, Inc. (8750.T) DCF-Bewertung |
Fully Editable: Tailor To Your Needs In Excel Or Sheets
Professional Design: Trusted, Industry-Standard Templates
Investor-Approved Valuation Models
MAC/PC Compatible, Fully Unlocked
No Expertise Is Needed; Easy To Follow
Dai-ichi Life Holdings, Inc. (8750.T) Bundle
Unabhängig davon, ob Sie ein Investor oder Analyst sind, ist dieser (8750T) DCF -Taschenrechner Ihr ultimatives Werkzeug für eine genaue Bewertung. Mit echten Daten von Dai-Ili Life Holdings, Inc. können Sie Prognosen anpassen und die Auswirkungen sofort beobachten.
Discounted Cash Flow (DCF) - (USD MM)
| Year | AY1 2021 |
AY2 2022 |
AY3 2023 |
AY4 2024 |
AY5 2025 |
FY1 2026 |
FY2 2027 |
FY3 2028 |
FY4 2029 |
FY5 2030 |
|---|---|---|---|---|---|---|---|---|---|---|
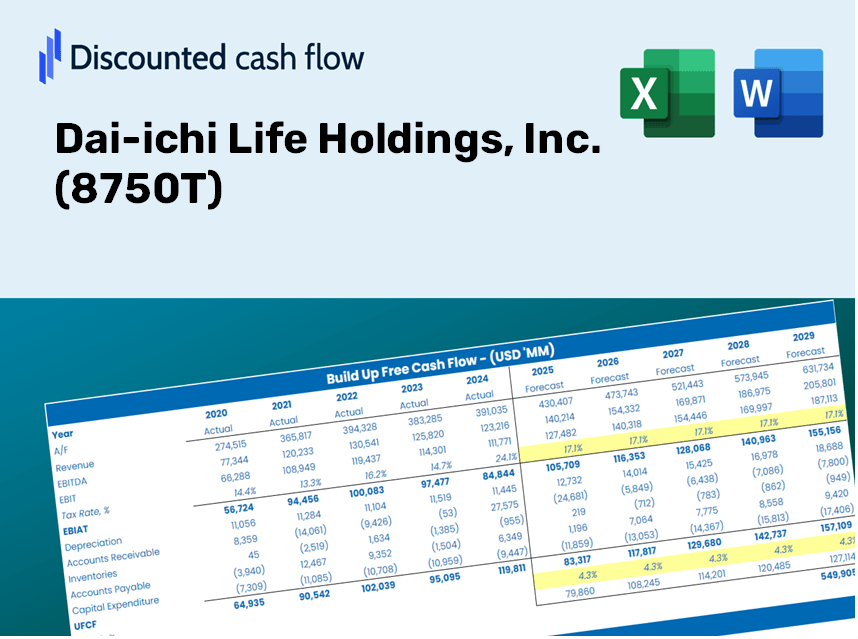
| Revenue | 6,803,497.0 | 7,100,396.0 | 7,707,319.0 | 9,561,697.0 | 9,300,892.0 | 10,097,141.6 | 10,961,558.3 | 11,899,977.6 | 12,918,735.0 | 14,024,708.3 |
| Revenue Growth, % | 0 | 4.36 | 8.55 | 24.06 | -2.73 | 8.56 | 8.56 | 8.56 | 8.56 | 8.56 |
| EBITDA | 589,330.0 | 591,045.0 | 395,024.0 | 565,729.0 | 611,622.0 | 698,806.1 | 758,630.9 | 823,577.3 | 894,083.8 | 970,626.3 |
| EBITDA, % | 8.66 | 8.32 | 5.13 | 5.92 | 6.58 | 6.92 | 6.92 | 6.92 | 6.92 | 6.92 |
| Depreciation | 73,313.0 | 89,964.0 | 104,735.0 | 99,056.0 | 131,777.0 | 124,322.0 | 134,965.2 | 146,519.6 | 159,063.1 | 172,680.5 |
| Depreciation, % | 1.08 | 1.27 | 1.36 | 1.04 | 1.42 | 1.23 | 1.23 | 1.23 | 1.23 | 1.23 |
| EBIT | 516,017.0 | 501,081.0 | 290,289.0 | 466,673.0 | 479,845.0 | 574,484.1 | 623,665.7 | 677,057.7 | 735,020.6 | 797,945.8 |
| EBIT, % | 7.58 | 7.06 | 3.77 | 4.88 | 5.16 | 5.69 | 5.69 | 5.69 | 5.69 | 5.69 |
| Total Cash | 1,884,141.0 | 2,183,874.0 | 1,619,087.0 | 2,064,416.0 | 1,889,228.0 | 2,450,793.0 | 2,660,605.5 | 2,888,380.0 | 3,135,654.3 | 3,404,097.7 |
| Total Cash, percent | .0 | .0 | .0 | .0 | .0 | .0 | .0 | .0 | .0 | .0 |
| Account Receivables | 1,668,969.0 | 1,924,898.0 | 1,623,872.0 | 1,853,137.0 | 2,048,027.0 | 2,304,380.1 | 2,501,658.1 | 2,715,825.2 | 2,948,327.0 | 3,200,733.4 |
| Account Receivables, % | 24.53 | 27.11 | 21.07 | 19.38 | 22.02 | 22.82 | 22.82 | 22.82 | 22.82 | 22.82 |
| Inventories | .0 | .0 | .0 | .0 | .0 | .0 | .0 | .0 | .0 | .0 |
| Inventories, % | 0 | 0 | 0 | 0 | 0 | 0 | 0 | 0 | 0 | 0 |
| Accounts Payable | 796,523.0 | 895,123.0 | 895,123.0 | 584,172.0 | 301,779.0 | 914,443.1 | 992,728.6 | 1,077,716.1 | 1,169,979.5 | 1,270,141.4 |
| Accounts Payable, % | 11.71 | 12.61 | 11.61 | 6.11 | 3.24 | 9.06 | 9.06 | 9.06 | 9.06 | 9.06 |
| Capital Expenditure | -38,166.0 | -99,465.0 | -117,860.0 | -51,139.0 | -60,115.0 | -94,351.3 | -102,428.7 | -111,197.6 | -120,717.2 | -131,051.8 |
| Capital Expenditure, % | -0.56098 | -1.4 | -1.53 | -0.53483 | -0.64634 | -0.93444 | -0.93444 | -0.93444 | -0.93444 | -0.93444 |
| Tax Rate, % | 23.6 | 23.6 | 23.6 | 23.6 | 23.6 | 23.6 | 23.6 | 23.6 | 23.6 | 23.6 |
| EBITAT | 389,014.6 | 432,402.1 | 196,025.2 | 350,569.2 | 366,615.7 | 437,450.4 | 474,900.6 | 515,556.8 | 559,693.7 | 607,609.1 |
| Depreciation | ||||||||||
| Changes in Account Receivables | ||||||||||
| Changes in Inventories | ||||||||||
| Changes in Accounts Payable | ||||||||||
| Capital Expenditure | ||||||||||
| UFCF | -448,284.4 | 265,572.1 | 483,926.2 | -141,729.8 | -39,005.3 | 823,732.2 | 388,444.6 | 421,699.3 | 457,801.0 | 496,993.4 |
| WACC, % | 4.21 | 4.31 | 4.13 | 4.21 | 4.22 | 4.22 | 4.22 | 4.22 | 4.22 | 4.22 |
| PV UFCF | ||||||||||
| SUM PV UFCF | 2,313,033.9 | |||||||||
| Long Term Growth Rate, % | 2.00 | |||||||||
| Free cash flow (T + 1) | 506,933 | |||||||||
| Terminal Value | 22,882,662 | |||||||||
| Present Terminal Value | 18,614,351 | |||||||||
| Enterprise Value | 20,927,384 | |||||||||
| Net Debt | -2,160,215 | |||||||||
| Equity Value | 23,087,599 | |||||||||
| Diluted Shares Outstanding, MM | 3,706 | |||||||||
| Equity Value Per Share | 6,229.96 |
What You'll Receive
- Authentic 8750T Financials: Features historical and projected data to ensure precise valuation.
- Customizable Inputs: Adjust WACC, tax rates, revenue growth, and capital expenditures to suit your analysis.
- Dynamic Calculations: Intrinsic value and NPV are updated automatically.
- Scenario Exploration: Evaluate various scenarios to assess Dai-ichi Life Holdings' future performance.
- User-Friendly Interface: Designed for professionals while remaining approachable for novices.
Key Features
- Comprehensive AAPL Data: Pre-loaded with Dai-ichi Life Holdings, Inc.'s historical financial metrics and future growth forecasts.
- Flexible Input Options: Modify parameters such as revenue growth, profit margins, discount rates, tax rates, and capital expenditures.
- Adaptive Valuation Model: Automatically recalculates Net Present Value (NPV) and intrinsic value based on your customized inputs.
- Scenario Analysis: Develop various forecasting scenarios to evaluate diverse valuation results.
- Intuitive Interface: Designed to be straightforward and accessible for both professionals and novices.
How It Operates
- Download the Template: Gain immediate access to the Excel-based DCF Calculator for Dai-ichi Life Holdings, Inc. (8750T).
- Input Your Assumptions: Modify the yellow-highlighted cells for growth rates, WACC, margins, and additional parameters.
- Instant Calculations: The model will automatically refresh to display Dai-ichi's intrinsic value.
- Test Scenarios: Experiment with various assumptions to assess potential changes in valuation.
- Analyze and Decide: Utilize the outcomes to inform your investment or financial evaluation.
Why Opt for This Calculator?
- Precision: Utilizes authentic Dai-ichi Life Holdings financial data for reliable results.
- Versatility: Allows users to effortlessly experiment with and adjust inputs.
- Efficiency: Avoid the complexity of constructing a DCF model from the ground up.
- Expert-Level: Crafted with the accuracy and effectiveness expected by CFOs.
- User-Friendly: Simple to navigate, making it accessible for individuals without extensive financial modeling skills.
Who Should Consider This Product?
- Institutional Investors: Create comprehensive and trustworthy valuation models for analyzing portfolios.
- Corporate Finance Departments: Evaluate valuation scenarios to inform strategic decisions.
- Financial Consultants and Advisors: Deliver precise valuation insights for Dai-ichi Life Holdings, Inc. (8750T) to clients.
- Academics and Students: Utilize real-world data for practicing and instructing financial modeling techniques.
- Investment Enthusiasts: Gain insights into how insurance companies like Dai-ichi Life are valued in the marketplace.
Contents of the Template
- In-Depth DCF Model: Editable template featuring comprehensive valuation computations.
- Actual Data: Dai-ichi Life Holdings, Inc.'s (8750T) historical and projected financials are preloaded for analysis.
- Adjustable Variables: Modify WACC, growth rates, and tax assumptions to explore various scenarios.
- Financial Statements: Complete annual and quarterly reports for enhanced understanding.
- Key Financial Ratios: Integrated analysis for assessing profitability, efficiency, and leverage.
- Visual Dashboard: Charts and tables providing clear, actionable insights.
Disclaimer
All information, articles, and product details provided on this website are for general informational and educational purposes only. We do not claim any ownership over, nor do we intend to infringe upon, any trademarks, copyrights, logos, brand names, or other intellectual property mentioned or depicted on this site. Such intellectual property remains the property of its respective owners, and any references here are made solely for identification or informational purposes, without implying any affiliation, endorsement, or partnership.
We make no representations or warranties, express or implied, regarding the accuracy, completeness, or suitability of any content or products presented. Nothing on this website should be construed as legal, tax, investment, financial, medical, or other professional advice. In addition, no part of this site—including articles or product references—constitutes a solicitation, recommendation, endorsement, advertisement, or offer to buy or sell any securities, franchises, or other financial instruments, particularly in jurisdictions where such activity would be unlawful.
All content is of a general nature and may not address the specific circumstances of any individual or entity. It is not a substitute for professional advice or services. Any actions you take based on the information provided here are strictly at your own risk. You accept full responsibility for any decisions or outcomes arising from your use of this website and agree to release us from any liability in connection with your use of, or reliance upon, the content or products found herein.