
|
Tokio Marine Holdings, Inc. (8766.t) DCF -Bewertung |
Fully Editable: Tailor To Your Needs In Excel Or Sheets
Professional Design: Trusted, Industry-Standard Templates
Investor-Approved Valuation Models
MAC/PC Compatible, Fully Unlocked
No Expertise Is Needed; Easy To Follow
Tokio Marine Holdings, Inc. (8766.T) Bundle
Als Investor oder Analyst ist dieser DCF-Rechner von Tokio Marine Holdings, Inc. (8766T) Ihre Anlaufstelle für eine genaue Bewertung. Ausgestattet mit echten Daten von Tokio Marine können Sie Prognosen anpassen und die Effekte in Echtzeit beobachten.
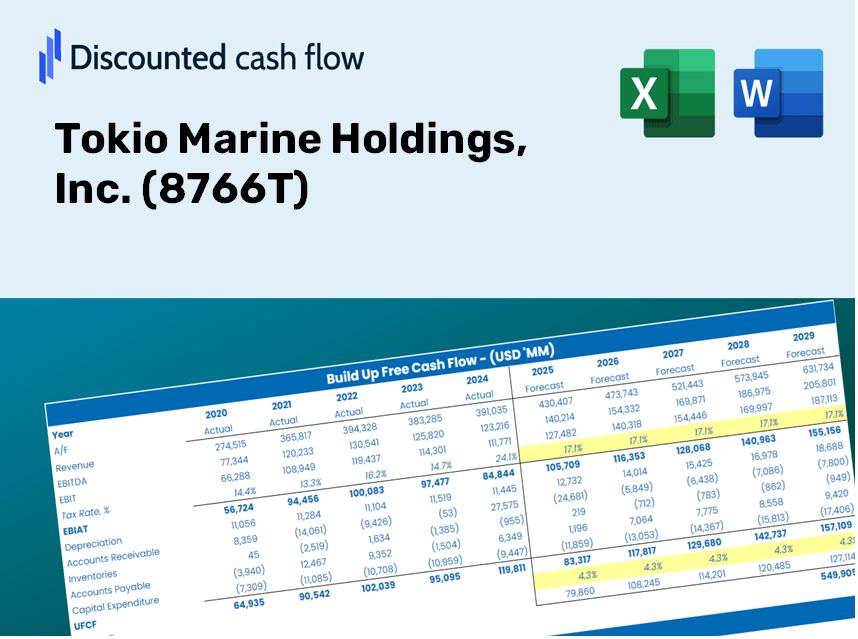
Discounted Cash Flow (DCF) - (USD MM)
| Year | AY1 2021 |
AY2 2022 |
AY3 2023 |
AY4 2024 |
AY5 2025 |
FY1 2026 |
FY2 2027 |
FY3 2028 |
FY4 2029 |
FY5 2030 |
|---|---|---|---|---|---|---|---|---|---|---|
| Revenue | 492,170.0 | 5,751,641.0 | 6,209,923.0 | 7,080,313.0 | 7,584,167.0 | 10,031,961.3 | 13,269,782.6 | 17,552,612.6 | 23,217,728.4 | 30,711,263.6 |
| Revenue Growth, % | 0 | 1068.63 | 7.97 | 14.02 | 7.12 | 32.28 | 32.28 | 32.28 | 32.28 | 32.28 |
| EBITDA | 385,873.0 | 724,576.0 | 726,818.0 | 1,060,190.0 | 1,714,052.0 | 2,814,535.3 | 3,722,928.2 | 4,924,505.5 | 6,513,892.4 | 8,616,255.0 |
| EBITDA, % | 78.4 | 12.6 | 11.7 | 14.97 | 22.6 | 28.06 | 28.06 | 28.06 | 28.06 | 28.06 |
| Depreciation | 142,699.0 | 161,906.0 | 193,206.0 | 212,320.0 | 236,858.0 | 823,460.3 | 1,089,232.6 | 1,440,783.0 | 1,905,796.6 | 2,520,893.5 |
| Depreciation, % | 28.99 | 2.81 | 3.11 | 3 | 3.12 | 8.21 | 8.21 | 8.21 | 8.21 | 8.21 |
| EBIT | 243,174.0 | 562,670.0 | 533,612.0 | 847,870.0 | 1,477,194.0 | 1,991,075.0 | 2,633,695.7 | 3,483,722.4 | 4,608,095.9 | 6,095,361.5 |
| EBIT, % | 49.41 | 9.78 | 8.59 | 11.98 | 19.48 | 19.85 | 19.85 | 19.85 | 19.85 | 19.85 |
| Total Cash | 812,011.0 | 848,819.0 | 871,993.0 | 896,898.0 | 1,071,138.0 | 3,121,758.2 | 4,129,307.4 | 5,462,043.8 | 7,224,921.6 | 9,556,769.2 |
| Total Cash, percent | .0 | .0 | .0 | .0 | .0 | .0 | .0 | .0 | .0 | .0 |
| Account Receivables | .0 | .0 | .0 | .0 | .0 | .0 | .0 | .0 | .0 | .0 |
| Account Receivables, % | 0 | 0 | 0 | 0 | 0 | 0 | 0 | 0 | 0 | 0 |
| Inventories | .0 | .0 | .0 | .0 | .0 | .0 | .0 | .0 | .0 | .0 |
| Inventories, % | 0 | 0 | 0 | 0 | 0 | 0 | 0 | 0 | 0 | 0 |
| Accounts Payable | .0 | .0 | .0 | .0 | .0 | .0 | .0 | .0 | .0 | .0 |
| Accounts Payable, % | 0 | 0 | 0 | 0 | 0 | 0 | 0 | 0 | 0 | 0 |
| Capital Expenditure | -26,224.0 | -29,050.0 | -24,877.0 | -20,723.0 | -26,148.0 | -137,866.6 | -182,363.2 | -241,221.0 | -319,075.2 | -422,056.9 |
| Capital Expenditure, % | -5.33 | -0.50507 | -0.4006 | -0.29268 | -0.34477 | -1.37 | -1.37 | -1.37 | -1.37 | -1.37 |
| Tax Rate, % | 27.24 | 27.24 | 27.24 | 27.24 | 27.24 | 27.24 | 27.24 | 27.24 | 27.24 | 27.24 |
| EBITAT | 161,801.0 | 426,854.9 | 384,661.0 | 717,827.9 | 1,074,865.5 | 1,481,010.6 | 1,959,007.6 | 2,591,278.4 | 3,427,615.1 | 4,533,879.8 |
| Depreciation | ||||||||||
| Changes in Account Receivables | ||||||||||
| Changes in Inventories | ||||||||||
| Changes in Accounts Payable | ||||||||||
| Capital Expenditure | ||||||||||
| UFCF | 278,276.0 | 559,710.9 | 552,990.0 | 909,424.9 | 1,285,575.5 | 2,166,604.2 | 2,865,877.0 | 3,790,840.5 | 5,014,336.4 | 6,632,716.4 |
| WACC, % | 4.45 | 4.47 | 4.46 | 4.49 | 4.46 | 4.47 | 4.47 | 4.47 | 4.47 | 4.47 |
| PV UFCF | ||||||||||
| SUM PV UFCF | 17,566,660.5 | |||||||||
| Long Term Growth Rate, % | 2.00 | |||||||||
| Free cash flow (T + 1) | 6,765,371 | |||||||||
| Terminal Value | 274,356,346 | |||||||||
| Present Terminal Value | 220,517,026 | |||||||||
| Enterprise Value | 238,083,686 | |||||||||
| Net Debt | -843,899 | |||||||||
| Equity Value | 238,927,585 | |||||||||
| Diluted Shares Outstanding, MM | 1,946 | |||||||||
| Equity Value Per Share | 122,751.76 |
What You Will Receive
- Authentic TMH Financials: Access to both historical and projected data for precise valuation.
- Customizable Parameters: Adjust WACC, tax rates, revenue growth, and capital expenditures as needed.
- Real-Time Calculations: Intrinsic value and NPV are calculated automatically.
- Scenario Evaluation: Analyze various scenarios to assess Tokio Marine’s future prospects.
- User-Friendly Interface: Designed for industry professionals while remaining easy to navigate for newcomers.
Key Features
- Authentic Tokio Marine Financials: Gain access to precise pre-loaded historical data and future forecasts.
- Tailorable Forecast Assumptions: Modify yellow-highlighted fields such as WACC, growth rates, and profit margins.
- Real-Time Calculations: Automatic updates for DCF, Net Present Value (NPV), and cash flow assessments.
- Interactive Dashboard: User-friendly charts and summaries to effectively visualize your valuation outcomes.
- Suitable for All Levels: An intuitive layout designed for investors, CFOs, and consultants alike.
How It Functions
- Step 1: Download the Excel spreadsheet.
- Step 2: Examine Tokio Marine Holdings, Inc.'s pre-filled financial data and forecasts.
- Step 3: Adjust key variables such as revenue growth, WACC, and tax rates (highlighted cells).
- Step 4: Observe the DCF model refresh in real-time as you modify your assumptions.
- Step 5: Evaluate the outputs and leverage the findings for investment strategies.
Why Opt for This Calculator for Tokio Marine Holdings, Inc. (8766T)?
- Accurate Data: Access genuine financials from Tokio Marine for trustworthy valuation outcomes.
- Customizable: Tailor essential parameters such as growth rates, WACC, and tax rates to fit your forecasts.
- Time-Saving: Utilize pre-configured calculations, eliminating the need for a fresh start.
- Professional-Grade Tool: Crafted for investors, analysts, and consultants focused on Tokio Marine.
- User-Friendly: Designed with an intuitive interface and guided instructions for all users.
Who Can Benefit from This Product?
- Investors: Assess Tokio Marine Holdings, Inc.'s (8766T) valuation prior to making stock transactions.
- CFOs and Financial Analysts: Enhance valuation processes and evaluate forecasts effectively.
- Startup Founders: Understand how large public companies like Tokio Marine Holdings, Inc. (8766T) are valued.
- Consultants: Provide comprehensive valuation reports for your clients.
- Students and Educators: Utilize real-world data to practice and teach valuation methods.
Contents of the Template
- Pre-Filled Data: Features Tokio Marine's historical financial information and projections.
- Discounted Cash Flow Model: An editable DCF valuation model with automatic computation capabilities.
- Weighted Average Cost of Capital (WACC): A specialized sheet for WACC calculations based on user-defined inputs.
- Key Financial Ratios: Assess Tokio Marine’s profitability, operational efficiency, and leverage metrics.
- Customizable Inputs: Easily adjust revenue growth, profit margins, and tax rates.
- Clear Dashboard: Visual charts and tables that summarize critical valuation outcomes.
Disclaimer
All information, articles, and product details provided on this website are for general informational and educational purposes only. We do not claim any ownership over, nor do we intend to infringe upon, any trademarks, copyrights, logos, brand names, or other intellectual property mentioned or depicted on this site. Such intellectual property remains the property of its respective owners, and any references here are made solely for identification or informational purposes, without implying any affiliation, endorsement, or partnership.
We make no representations or warranties, express or implied, regarding the accuracy, completeness, or suitability of any content or products presented. Nothing on this website should be construed as legal, tax, investment, financial, medical, or other professional advice. In addition, no part of this site—including articles or product references—constitutes a solicitation, recommendation, endorsement, advertisement, or offer to buy or sell any securities, franchises, or other financial instruments, particularly in jurisdictions where such activity would be unlawful.
All content is of a general nature and may not address the specific circumstances of any individual or entity. It is not a substitute for professional advice or services. Any actions you take based on the information provided here are strictly at your own risk. You accept full responsibility for any decisions or outcomes arising from your use of this website and agree to release us from any liability in connection with your use of, or reliance upon, the content or products found herein.