
|
Mitsubishi Estate Co., Ltd. (8802.t) DCF -Bewertung |
Fully Editable: Tailor To Your Needs In Excel Or Sheets
Professional Design: Trusted, Industry-Standard Templates
Investor-Approved Valuation Models
MAC/PC Compatible, Fully Unlocked
No Expertise Is Needed; Easy To Follow
Mitsubishi Estate Co., Ltd. (8802.T) Bundle
Entdecken Sie die finanzielle Zukunft von Mitsubishi Estate Co., Ltd. (8802T) mit unserem benutzerfreundlichen DCF-Taschenrechner! Geben Sie Ihre Prognosen für Wachstum, Margen und Kosten ein, um den inneren Wert von Mitsubishi Estate Co., Ltd. (8802T) zu berechnen und Ihre Anlagestrategie zu verbessern.
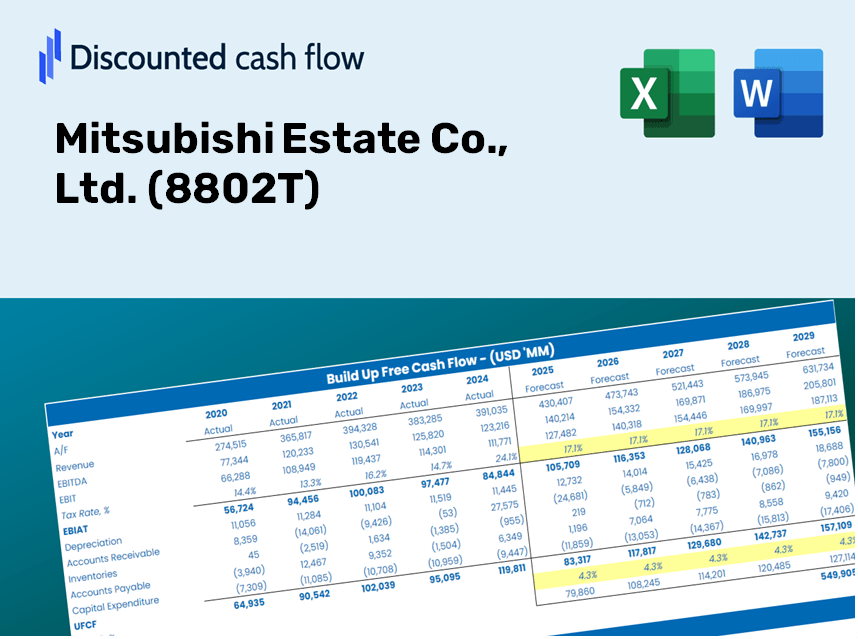
Discounted Cash Flow (DCF) - (USD MM)
| Year | AY1 2021 |
AY2 2022 |
AY3 2023 |
AY4 2024 |
AY5 2025 |
FY1 2026 |
FY2 2027 |
FY3 2028 |
FY4 2029 |
FY5 2030 |
|---|---|---|---|---|---|---|---|---|---|---|
| Revenue | 1,207,594.0 | 1,349,489.0 | 1,377,827.0 | 1,504,687.0 | 1,579,812.0 | 1,690,596.8 | 1,809,150.4 | 1,936,017.5 | 2,071,781.3 | 2,217,065.6 |
| Revenue Growth, % | 0 | 11.75 | 2.1 | 9.21 | 4.99 | 7.01 | 7.01 | 7.01 | 7.01 | 7.01 |
| EBITDA | 316,523.0 | 373,103.0 | 393,332.0 | 412,541.0 | 414,275.0 | 459,998.4 | 492,255.9 | 526,775.5 | 563,715.8 | 603,246.5 |
| EBITDA, % | 26.21 | 27.65 | 28.55 | 27.42 | 26.22 | 27.21 | 27.21 | 27.21 | 27.21 | 27.21 |
| Depreciation | 92,129.0 | 94,125.0 | 96,629.0 | 102,013.0 | 105,042.0 | 118,496.8 | 126,806.4 | 135,698.7 | 145,214.7 | 155,397.9 |
| Depreciation, % | 7.63 | 6.97 | 7.01 | 6.78 | 6.65 | 7.01 | 7.01 | 7.01 | 7.01 | 7.01 |
| EBIT | 224,394.0 | 278,978.0 | 296,703.0 | 310,528.0 | 309,233.0 | 341,501.6 | 365,449.5 | 391,076.8 | 418,501.1 | 447,848.6 |
| EBIT, % | 18.58 | 20.67 | 21.53 | 20.64 | 19.57 | 20.2 | 20.2 | 20.2 | 20.2 | 20.2 |
| Total Cash | 670,848.0 | 861,918.0 | 945,005.0 | 1,240,878.0 | 1,323,324.0 | 1,197,758.0 | 1,281,751.1 | 1,371,634.3 | 1,467,820.6 | 1,570,751.9 |
| Total Cash, percent | .0 | .0 | .0 | .0 | .0 | .0 | .0 | .0 | .0 | .0 |
| Account Receivables | 52,031.0 | 60,645.0 | 69,987.0 | 89,174.0 | 116,227.0 | 91,851.9 | 98,293.0 | 105,185.9 | 112,562.0 | 120,455.5 |
| Account Receivables, % | 4.31 | 4.49 | 5.08 | 5.93 | 7.36 | 5.43 | 5.43 | 5.43 | 5.43 | 5.43 |
| Inventories | 364,832.0 | 347,386.0 | 493,541.0 | 513,832.0 | .0 | 425,768.4 | 455,625.6 | 487,576.4 | 521,767.9 | 558,357.0 |
| Inventories, % | 30.21 | 25.74 | 35.82 | 34.15 | 0 | 25.18 | 25.18 | 25.18 | 25.18 | 25.18 |
| Accounts Payable | 60,507.0 | 60,516.0 | 66,407.0 | 87,094.0 | 93,865.0 | 88,060.8 | 94,236.1 | 100,844.5 | 107,916.2 | 115,483.9 |
| Accounts Payable, % | 5.01 | 4.48 | 4.82 | 5.79 | 5.94 | 5.21 | 5.21 | 5.21 | 5.21 | 5.21 |
| Capital Expenditure | -315,784.0 | -328,591.0 | -286,301.0 | -451,402.0 | -443,599.0 | -437,381.9 | -468,053.5 | -500,875.9 | -535,999.9 | -573,587.1 |
| Capital Expenditure, % | -26.15 | -24.35 | -20.78 | -30 | -28.08 | -25.87 | -25.87 | -25.87 | -25.87 | -25.87 |
| Tax Rate, % | 40.26 | 40.26 | 40.26 | 40.26 | 40.26 | 40.26 | 40.26 | 40.26 | 40.26 | 40.26 |
| EBITAT | 151,244.2 | 170,578.7 | 193,979.3 | 190,516.4 | 184,740.8 | 215,158.1 | 230,246.1 | 246,392.2 | 263,670.5 | 282,160.4 |
| Depreciation | ||||||||||
| Changes in Account Receivables | ||||||||||
| Changes in Inventories | ||||||||||
| Changes in Accounts Payable | ||||||||||
| Capital Expenditure | ||||||||||
| UFCF | -428,766.8 | -55,046.3 | -145,298.7 | -177,663.6 | 339,733.8 | -510,924.6 | -141,124.0 | -151,020.3 | -161,610.7 | -172,943.7 |
| WACC, % | 3.69 | 3.59 | 3.66 | 3.59 | 3.57 | 3.62 | 3.62 | 3.62 | 3.62 | 3.62 |
| PV UFCF | ||||||||||
| SUM PV UFCF | -1,045,204.6 | |||||||||
| Long Term Growth Rate, % | 2.00 | |||||||||
| Free cash flow (T + 1) | -176,403 | |||||||||
| Terminal Value | -10,888,697 | |||||||||
| Present Terminal Value | -9,115,005 | |||||||||
| Enterprise Value | -10,160,209 | |||||||||
| Net Debt | 3,083,152 | |||||||||
| Equity Value | -13,243,361 | |||||||||
| Diluted Shares Outstanding, MM | 1,254 | |||||||||
| Equity Value Per Share | -10,563.42 |
What You Will Receive
- Customizable Excel Template: A comprehensive Excel-based DCF Calculator featuring pre-loaded financial data for Mitsubishi Estate Co., Ltd. (8802T).
- Actual Market Data: Access to historical performance metrics and future projections (highlighted in the yellow cells).
- Adjustable Forecasts: Modify key assumptions like revenue growth rates, EBITDA percentages, and WACC.
- Real-Time Calculations: Instantly visualize how your inputs affect the valuation of Mitsubishi Estate Co., Ltd. (8802T).
- Professional Resource: Designed for investors, CFOs, consultants, and financial analysts.
- Intuitive Interface: Organized for ease of navigation, complete with clear step-by-step guidance.
Key Features
- Pre-Loaded Data: Mitsubishi Estate Co., Ltd.’s historical financial statements and pre-filled forecasts.
- Fully Adjustable Inputs: Modify WACC, tax rates, revenue growth, and EBITDA margins to suit your analysis.
- Instant Results: Monitor Mitsubishi Estate Co., Ltd.’s intrinsic value recalculating in real time.
- Clear Visual Outputs: Dashboard charts illustrate valuation outcomes and key metrics.
- Built for Accuracy: A professional-grade tool designed for analysts, investors, and finance professionals.
How It Works
- Step 1: Download the Excel file.
- Step 2: Review Mitsubishi Estate Co., Ltd.’s (8802T) pre-filled financial data and projections.
- Step 3: Adjust key variables such as revenue growth, WACC, and tax rates (highlighted cells).
- Step 4: Observe the DCF model refresh immediately as you modify your assumptions.
- Step 5: Evaluate the outputs and leverage the insights for your investment strategies.
Why Choose This Calculator for Mitsubishi Estate Co., Ltd. (8802T)?
- Designed for Industry Leaders: A sophisticated tool utilized by real estate professionals, investment analysts, and financial consultants.
- Comprehensive Financial Data: Mitsubishi Estate's historical and projected financial figures are preloaded for enhanced precision.
- Robust Scenario Analysis: Effortlessly simulate various market conditions and investment assumptions.
- Insightful Outputs: Instantly calculates intrinsic value, net present value (NPV), and other essential metrics.
- User-Friendly Interface: Step-by-step guidance ensures a smooth user experience.
Who Should Use This Product?
- Individual Investors: Gain insights to make informed decisions regarding the purchase or sale of Mitsubishi Estate Co., Ltd. (8802T) shares.
- Financial Analysts: Enhance valuation methodologies with comprehensive financial models tailored for Mitsubishi Estate Co., Ltd. (8802T).
- Consultants: Provide clients with accurate and timely valuation assessments related to Mitsubishi Estate Co., Ltd. (8802T).
- Business Owners: Learn from the valuation strategies of large corporations like Mitsubishi Estate Co., Ltd. (8802T) to shape your competitive approach.
- Finance Students: Develop your valuation skills through the analysis of real-world data and case studies featuring Mitsubishi Estate Co., Ltd. (8802T).
Contents of the Template
- Comprehensive DCF Model: An editable template with detailed valuation calculations tailored for Mitsubishi Estate Co., Ltd. (8802T).
- Real-World Data: Historical and projected financials for Mitsubishi Estate preloaded for in-depth analysis.
- Customizable Parameters: Modify WACC, growth rates, and tax assumptions to explore various scenarios.
- Financial Statements: Complete annual and quarterly breakdowns for enhanced insights.
- Key Ratios: Integrated analysis of profitability, efficiency, and leverage metrics.
- Dashboard with Visual Outputs: User-friendly charts and tables to present clear, actionable results.
Disclaimer
All information, articles, and product details provided on this website are for general informational and educational purposes only. We do not claim any ownership over, nor do we intend to infringe upon, any trademarks, copyrights, logos, brand names, or other intellectual property mentioned or depicted on this site. Such intellectual property remains the property of its respective owners, and any references here are made solely for identification or informational purposes, without implying any affiliation, endorsement, or partnership.
We make no representations or warranties, express or implied, regarding the accuracy, completeness, or suitability of any content or products presented. Nothing on this website should be construed as legal, tax, investment, financial, medical, or other professional advice. In addition, no part of this site—including articles or product references—constitutes a solicitation, recommendation, endorsement, advertisement, or offer to buy or sell any securities, franchises, or other financial instruments, particularly in jurisdictions where such activity would be unlawful.
All content is of a general nature and may not address the specific circumstances of any individual or entity. It is not a substitute for professional advice or services. Any actions you take based on the information provided here are strictly at your own risk. You accept full responsibility for any decisions or outcomes arising from your use of this website and agree to release us from any liability in connection with your use of, or reliance upon, the content or products found herein.