
|
Heiwa Real Estate Co., Ltd. (8803.t) DCF -Bewertung |
Fully Editable: Tailor To Your Needs In Excel Or Sheets
Professional Design: Trusted, Industry-Standard Templates
Investor-Approved Valuation Models
MAC/PC Compatible, Fully Unlocked
No Expertise Is Needed; Easy To Follow
Heiwa Real Estate Co., Ltd. (8803.T) Bundle
Bewerten Sie die finanzielle Aussichten von Heiwa Real Estate Co., Ltd. mit Zuversicht! Dieser (8803T) DCF-Taschenrechner verfügt über vorgeladene Finanzdaten und bietet eine vollständige Anpassung, um das Umsatzwachstum, WACC, Margen und andere wesentliche Annahmen zu ändern, um sich mit Ihren Vorhersagen auszurichten.
Discounted Cash Flow (DCF) - (USD MM)
| Year | AY1 2020 |
AY2 2021 |
AY3 2022 |
AY4 2023 |
AY5 2024 |
FY1 2025 |
FY2 2026 |
FY3 2027 |
FY4 2028 |
FY5 2029 |
|---|---|---|---|---|---|---|---|---|---|---|
| Revenue | 35,048.0 | 57,818.0 | 44,522.0 | 44,433.0 | 42,075.0 | 45,910.7 | 50,096.0 | 54,662.9 | 59,646.1 | 65,083.5 |
| Revenue Growth, % | 0 | 64.97 | -23 | -0.1999 | -5.31 | 9.12 | 9.12 | 9.12 | 9.12 | 9.12 |
| EBITDA | 16,306.0 | 18,034.0 | 16,453.0 | 18,808.0 | 18,833.0 | 18,525.9 | 20,214.7 | 22,057.6 | 24,068.4 | 26,262.5 |
| EBITDA, % | 46.52 | 31.19 | 36.95 | 42.33 | 44.76 | 40.35 | 40.35 | 40.35 | 40.35 | 40.35 |
| Depreciation | 5,077.0 | 5,418.0 | 5,668.0 | 5,785.0 | 5,636.0 | 5,784.9 | 6,312.3 | 6,887.8 | 7,515.7 | 8,200.8 |
| Depreciation, % | 14.49 | 9.37 | 12.73 | 13.02 | 13.4 | 12.6 | 12.6 | 12.6 | 12.6 | 12.6 |
| EBIT | 11,229.0 | 12,616.0 | 10,785.0 | 13,023.0 | 13,197.0 | 12,740.9 | 13,902.4 | 15,169.8 | 16,552.7 | 18,061.7 |
| EBIT, % | 32.04 | 21.82 | 24.22 | 29.31 | 31.37 | 27.75 | 27.75 | 27.75 | 27.75 | 27.75 |
| Total Cash | 29,701.0 | 28,225.0 | 27,907.0 | 28,421.0 | 25,340.0 | 29,422.5 | 32,104.7 | 35,031.4 | 38,225.0 | 41,709.7 |
| Total Cash, percent | .0 | .0 | .0 | .0 | .0 | .0 | .0 | .0 | .0 | .0 |
| Account Receivables | 3,291.0 | 3,408.0 | 2,970.0 | 2,114.0 | 2,291.0 | 2,952.8 | 3,222.0 | 3,515.7 | 3,836.2 | 4,185.9 |
| Account Receivables, % | 9.39 | 5.89 | 6.67 | 4.76 | 5.45 | 6.43 | 6.43 | 6.43 | 6.43 | 6.43 |
| Inventories | 31,096.0 | 19,874.0 | 14,451.0 | 21,212.0 | .0 | 18,666.8 | 20,368.5 | 22,225.4 | 24,251.5 | 26,462.3 |
| Inventories, % | 88.72 | 34.37 | 32.46 | 47.74 | 0 | 40.66 | 40.66 | 40.66 | 40.66 | 40.66 |
| Accounts Payable | 1,818.0 | 3,367.0 | 5,727.0 | 1,923.0 | 1,698.0 | 2,960.1 | 3,229.9 | 3,524.4 | 3,845.7 | 4,196.3 |
| Accounts Payable, % | 5.19 | 5.82 | 12.86 | 4.33 | 4.04 | 6.45 | 6.45 | 6.45 | 6.45 | 6.45 |
| Capital Expenditure | -31,125.0 | -20,374.0 | -40,613.0 | -18,264.0 | -23,717.0 | -28,716.0 | -31,333.8 | -34,190.3 | -37,307.2 | -40,708.2 |
| Capital Expenditure, % | -88.81 | -35.24 | -91.22 | -41.1 | -56.37 | -62.55 | -62.55 | -62.55 | -62.55 | -62.55 |
| Tax Rate, % | 23.07 | 23.07 | 23.07 | 23.07 | 23.07 | 23.07 | 23.07 | 23.07 | 23.07 | 23.07 |
| EBITAT | 7,823.8 | 8,755.0 | 7,431.6 | 8,868.1 | 10,151.9 | 8,995.1 | 9,815.1 | 10,709.9 | 11,686.2 | 12,751.5 |
| Depreciation | ||||||||||
| Changes in Account Receivables | ||||||||||
| Changes in Inventories | ||||||||||
| Changes in Accounts Payable | ||||||||||
| Capital Expenditure | ||||||||||
| UFCF | -50,793.2 | 6,453.0 | -19,292.4 | -13,319.9 | 12,880.9 | -32,002.5 | -16,907.5 | -18,448.8 | -20,130.7 | -21,965.8 |
| WACC, % | 3.07 | 3.06 | 3.05 | 3.03 | 3.27 | 3.09 | 3.09 | 3.09 | 3.09 | 3.09 |
| PV UFCF | ||||||||||
| SUM PV UFCF | -100,470.7 | |||||||||
| Long Term Growth Rate, % | 2.00 | |||||||||
| Free cash flow (T + 1) | -22,405 | |||||||||
| Terminal Value | -2,048,847 | |||||||||
| Present Terminal Value | -1,759,350 | |||||||||
| Enterprise Value | -1,859,820 | |||||||||
| Net Debt | 220,439 | |||||||||
| Equity Value | -2,080,259 | |||||||||
| Diluted Shares Outstanding, MM | 34 | |||||||||
| Equity Value Per Share | -61,566.11 |
What You Will Receive
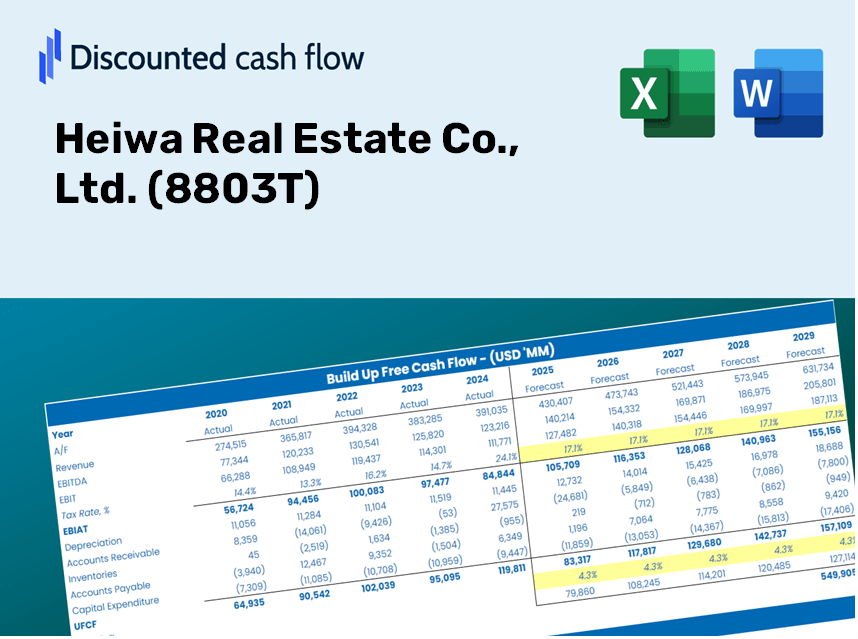
- Customizable Excel Template: An adaptable Excel-based DCF Calculator featuring pre-loaded financials for Heiwa Real Estate Co., Ltd. (8803T).
- Comprehensive Data: Access to historical figures and future estimates (highlighted in the yellow cells).
- Flexible Forecasting: Adjust key forecast parameters such as revenue growth, EBITDA %, and WACC.
- Instant Calculations: Quickly observe how your inputs affect the valuation of Heiwa Real Estate Co., Ltd. (8803T).
- Professional Resource: Designed for investors, CFOs, consultants, and financial analysts.
- User-Centric Layout: Organized for clarity and simplicity, complete with step-by-step guidance.
Highlighted Features
- Authentic Heiwa Financial Data: Gain access to reliable historical figures and future forecasts for Heiwa Real Estate Co., Ltd. (8803T).
- Tailorable Forecast Variables: Modify the yellow-highlighted fields such as WACC, growth rates, and profit margins to suit your analysis.
- Real-Time Calculations: Enjoy automatic updates for DCF, Net Present Value (NPV), and cash flow assessments.
- User-Friendly Dashboard: Clear and concise charts and summaries to effectively illustrate your valuation findings.
- Designed for All Experience Levels: A straightforward, intuitive interface crafted for investors, CFOs, and consulting professionals.
How It Works
- Step 1: Download the Excel file for Heiwa Real Estate Co., Ltd. (8803T).
- Step 2: Review the pre-filled financial data and forecasts for Heiwa Real Estate Co., Ltd. (8803T).
- Step 3: Adjust key inputs such as revenue growth, WACC, and tax rates (highlighted cells).
- Step 4: Observe the DCF model refresh in real-time as you modify assumptions.
- Step 5: Evaluate the outputs and apply the findings for your investment strategies.
Why Opt for This Calculator?
- All-in-One Solution: Combines DCF, WACC, and financial ratio evaluations in a single tool.
- Adjustable Parameters: Modify the yellow-highlighted cells to explore different scenarios.
- In-Depth Analytics: Automatically determines Heiwa Real Estate Co., Ltd.'s intrinsic value and Net Present Value.
- Preloaded Information: Historical and projected data provide reliable starting points.
- Expert-Level Design: Perfect for financial analysts, investors, and business advisors.
Who Should Use Heiwa Real Estate Co., Ltd. ([8803T])?
- Real Estate Students: Master valuation methods and apply them to real market data.
- Researchers: Integrate industry-standard models into your academic work or studies.
- Property Investors: Validate your investment strategies and evaluate valuation scenarios for Heiwa Real Estate Co., Ltd. ([8803T]).
- Market Analysts: Enhance your analysis with a ready-to-use, customizable DCF model.
- Small Business Owners: Learn how large real estate companies like Heiwa are assessed in the market.
Contents of the Template
- Historical Data: Contains Heiwa Real Estate's previous financials and foundational forecasts.
- DCF and Levered DCF Models: Comprehensive templates for calculating the intrinsic value of Heiwa Real Estate (8803T).
- WACC Sheet: Pre-configured calculations for the Weighted Average Cost of Capital.
- Editable Inputs: Adjust key drivers such as growth rates, EBITDA percentages, and CAPEX assumptions.
- Quarterly and Annual Statements: A thorough analysis of Heiwa Real Estate's financial performance.
- Interactive Dashboard: Dynamically visualize valuation results and forecasts.
Disclaimer
All information, articles, and product details provided on this website are for general informational and educational purposes only. We do not claim any ownership over, nor do we intend to infringe upon, any trademarks, copyrights, logos, brand names, or other intellectual property mentioned or depicted on this site. Such intellectual property remains the property of its respective owners, and any references here are made solely for identification or informational purposes, without implying any affiliation, endorsement, or partnership.
We make no representations or warranties, express or implied, regarding the accuracy, completeness, or suitability of any content or products presented. Nothing on this website should be construed as legal, tax, investment, financial, medical, or other professional advice. In addition, no part of this site—including articles or product references—constitutes a solicitation, recommendation, endorsement, advertisement, or offer to buy or sell any securities, franchises, or other financial instruments, particularly in jurisdictions where such activity would be unlawful.
All content is of a general nature and may not address the specific circumstances of any individual or entity. It is not a substitute for professional advice or services. Any actions you take based on the information provided here are strictly at your own risk. You accept full responsibility for any decisions or outcomes arising from your use of this website and agree to release us from any liability in connection with your use of, or reliance upon, the content or products found herein.