
|
Aeon Mall Co., Ltd. (8905.t) DCF -Bewertung |
Fully Editable: Tailor To Your Needs In Excel Or Sheets
Professional Design: Trusted, Industry-Standard Templates
Investor-Approved Valuation Models
MAC/PC Compatible, Fully Unlocked
No Expertise Is Needed; Easy To Follow
AEON Mall Co., Ltd. (8905.T) Bundle
Verbessern Sie Ihre Anlagestrategien mit dem DCF -Taschenrechner der Aeon Mall Co., Ltd. (8905T)! Erforschen Sie genaue Finanzdaten, passen Sie Wachstumsprojektionen und -kosten an und beobachten Sie sofort, wie sich diese Modifikationen auf den inneren Wert der Aeon Mall Co., Ltd. (8905T) auswirken.
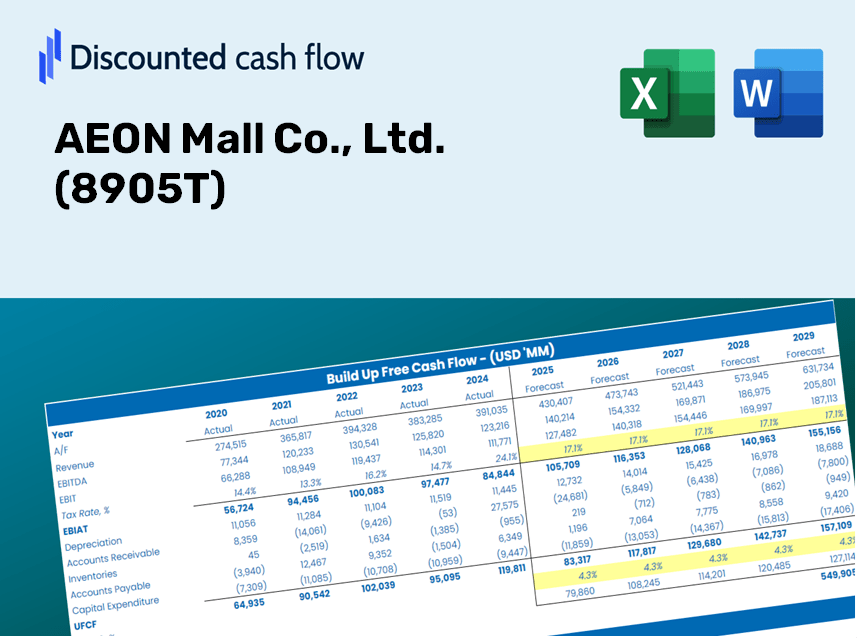
Discounted Cash Flow (DCF) - (USD MM)
| Year | AY1 2020 |
AY2 2021 |
AY3 2022 |
AY4 2023 |
AY5 2024 |
FY1 2025 |
FY2 2026 |
FY3 2027 |
FY4 2028 |
FY5 2029 |
|---|---|---|---|---|---|---|---|---|---|---|
| Revenue | 280 688,0 | 316 813,0 | 398 244,0 | 423 168,0 | 449 753,0 | 507 224,9 | 572 040,9 | 645 139,4 | 727 578,8 | 820 552,8 |
| Revenue Growth, % | 0 | 12.87 | 25.7 | 6.26 | 6.28 | 12.78 | 12.78 | 12.78 | 12.78 | 12.78 |
| EBITDA | 92 981,0 | 101 964,0 | 114 403,0 | 122 961,0 | 120 185,0 | 151 981,8 | 171 402,8 | 193 305,6 | 218 007,3 | 245 865,4 |
| EBITDA, % | 33.13 | 32.18 | 28.73 | 29.06 | 26.72 | 29.96 | 29.96 | 29.96 | 29.96 | 29.96 |
| Depreciation | 58 586,0 | 63 735,0 | 70 422,0 | 73 257,0 | 76 614,0 | 94 363,3 | 106 421,6 | 120 020,7 | 135 357,6 | 152 654,3 |
| Depreciation, % | 20.87 | 20.12 | 17.68 | 17.31 | 17.03 | 18.6 | 18.6 | 18.6 | 18.6 | 18.6 |
| EBIT | 34 395,0 | 38 229,0 | 43 981,0 | 49 704,0 | 43 571,0 | 57 618,5 | 64 981,3 | 73 284,9 | 82 649,7 | 93 211,1 |
| EBIT, % | 12.25 | 12.07 | 11.04 | 11.75 | 9.69 | 11.36 | 11.36 | 11.36 | 11.36 | 11.36 |
| Total Cash | 131 442,0 | 87 148,0 | 92 683,0 | 129 915,0 | 90 699,0 | 150 621,6 | 169 868,8 | 191 575,6 | 216 056,1 | 243 665,0 |
| Total Cash, percent | 46.83 | 27.51 | 23.27 | 30.7 | 20.17 | 29.7 | 29.7 | 29.7 | 29.7 | 29.7 |
| Account Receivables | 7 528,0 | 7 935,0 | 13 929,0 | 12 081,0 | 13 610,0 | 14 775,7 | 16 663,8 | 18 793,2 | 21 194,7 | 23 903,1 |
| Account Receivables, % | 2.68 | 2.5 | 3.5 | 2.85 | 3.03 | 2.91 | 2.91 | 2.91 | 2.91 | 2.91 |
| Inventories | 3 796,0 | 13 338,0 | 29 886,0 | ,0 | ,0 | 13 255,7 | 14 949,6 | 16 859,9 | 19 014,4 | 21 444,1 |
| Inventories, % | 1.35 | 4.21 | 7.5 | 0 | 0 | 2.61 | 2.61 | 2.61 | 2.61 | 2.61 |
| Accounts Payable | 1 582,0 | 3 089,0 | 6 868,0 | 11 771,0 | 14 278,0 | 9 352,7 | 10 547,8 | 11 895,7 | 13 415,8 | 15 130,1 |
| Accounts Payable, % | 0.56362 | 0.97502 | 1.72 | 2.78 | 3.17 | 1.84 | 1.84 | 1.84 | 1.84 | 1.84 |
| Capital Expenditure | -58 527,0 | -118 940,0 | -100 619,0 | -105 349,0 | -87 675,0 | -129 899,2 | -146 498,4 | -165 218,8 | -186 331,4 | -210 141,8 |
| Capital Expenditure, % | -20.85 | -37.54 | -25.27 | -24.9 | -19.49 | -25.61 | -25.61 | -25.61 | -25.61 | -25.61 |
| Tax Rate, % | 51.02 | 51.02 | 51.02 | 51.02 | 51.02 | 51.02 | 51.02 | 51.02 | 51.02 | 51.02 |
| EBITAT | -15 021,6 | 28 183,8 | 23 238,8 | 27 874,6 | 21 343,2 | 26 692,1 | 30 103,0 | 33 949,7 | 38 288,0 | 43 180,6 |
| Depreciation | ||||||||||
| Changes in Account Receivables | ||||||||||
| Changes in Inventories | ||||||||||
| Changes in Accounts Payable | ||||||||||
| Capital Expenditure | ||||||||||
| UFCF | -24 704,6 | -35 463,2 | -25 721,2 | 32 419,6 | 11 260,2 | -28 190,5 | -12 360,8 | -13 940,3 | -15 721,6 | -17 730,6 |
| WACC, % | 2.09 | 3.68 | 3.23 | 3.3 | 3.15 | 3.09 | 3.09 | 3.09 | 3.09 | 3.09 |
| PV UFCF | ||||||||||
| SUM PV UFCF | ,0 | ,0 | ,0 | ,0 | ,0 | ,0 | ,0 | ,0 | ,0 | -80 847,8 |
| Long Term Growth Rate, % | 2.90 | |||||||||
| Free cash flow (T + 1) | -18,245 | |||||||||
| Terminal Value | -9,598,606 | |||||||||
| Present Terminal Value | -8,243,731 | |||||||||
| Enterprise Value | -8,324,579 | |||||||||
| Net Debt | 751,388 | |||||||||
| Equity Value | -9,075,967 | |||||||||
| Diluted Shares Outstanding, MM | 228 | |||||||||
| Equity Value Per Share | -39,878.29 |
What You Will Receive
- Customizable Excel Template: An Excel-based DCF Calculator tailored for AEON Mall Co., Ltd. (8905T) featuring pre-filled financial data.
- Up-to-Date Data: Access to historical performance metrics and forward-looking projections (highlighted in the yellow cells).
- Adjustable Forecasts: Modify key assumptions such as revenue growth, EBITDA margin, and WACC to suit your analysis.
- Instant Calculations: Quickly observe how changes to your inputs affect AEON Mall's (8905T) valuation.
- Professional Utility: Designed for investors, CFOs, consultants, and financial analysts alike.
- Intuitive Layout: Organized for ease of navigation, including clear step-by-step guidance.
Key Features
- Customizable Forecast Inputs: Adjust essential factors such as tenant sales growth, rental income, and capital investment.
- Instant DCF Valuation: Quickly computes intrinsic value, NPV, and additional financial metrics.
- Exceptional Accuracy: Leverages AEON Mall’s actual financial data for precise valuation results.
- Effortless Scenario Analysis: Easily explore various assumptions and evaluate results side by side.
- Efficiency Booster: Remove the hassle of creating elaborate valuation models from ground zero.
How It Functions
- Step 1: Download the prebuilt Excel template featuring AEON Mall Co., Ltd.’s (8905T) data.
- Step 2: Navigate through the pre-filled sheets to familiarize yourself with essential metrics.
- Step 3: Revise forecasts and assumptions in the editable yellow cells (WACC, growth, margins).
- Step 4: Instantly observe recalculated outcomes, including AEON Mall Co., Ltd.'s (8905T) intrinsic value.
- Step 5: Utilize the results to make informed investment choices or to create comprehensive reports.
Why Choose AEON Mall's Calculator?
- Designed for Experts: A sophisticated tool utilized by analysts, CFOs, and industry consultants.
- Comprehensive Data: AEON Mall’s historical and projected financials preloaded for maximum accuracy.
- Scenario Analysis: Effortlessly simulate various forecasts and assumptions.
- Clear Results: Automatically computes intrinsic value, NPV, and essential metrics.
- User-Friendly: Guided instructions lead you through each step of the process.
Who Should Utilize This Service?
- Investors: Assess the fair value of AEON Mall Co., Ltd. (8905T) prior to making investment choices.
- CFOs: Utilize a high-quality DCF model for comprehensive financial reporting and analysis.
- Consultants: Efficiently customize the template for client valuation reports.
- Entrepreneurs: Acquire knowledge about financial modeling practices used by top-tier companies.
- Educators: Employ it as a resource to illustrate valuation techniques in the classroom.
Contents of the AEON Mall Template
- Comprehensive DCF Model: An editable template featuring in-depth valuation calculations.
- Real-World Data: AEON Mall's (8905T) historical and projected financials preloaded for thorough analysis.
- Customizable Parameters: Modify WACC, growth rates, and tax assumptions to explore different scenarios.
- Financial Statements: Complete annual and quarterly breakdowns for enhanced insights.
- Key Ratios: Integrated analysis for assessing profitability, efficiency, and leverage.
- Dashboard with Visual Outputs: Graphs and tables designed for clear, actionable insights.
Disclaimer
All information, articles, and product details provided on this website are for general informational and educational purposes only. We do not claim any ownership over, nor do we intend to infringe upon, any trademarks, copyrights, logos, brand names, or other intellectual property mentioned or depicted on this site. Such intellectual property remains the property of its respective owners, and any references here are made solely for identification or informational purposes, without implying any affiliation, endorsement, or partnership.
We make no representations or warranties, express or implied, regarding the accuracy, completeness, or suitability of any content or products presented. Nothing on this website should be construed as legal, tax, investment, financial, medical, or other professional advice. In addition, no part of this site—including articles or product references—constitutes a solicitation, recommendation, endorsement, advertisement, or offer to buy or sell any securities, franchises, or other financial instruments, particularly in jurisdictions where such activity would be unlawful.
All content is of a general nature and may not address the specific circumstances of any individual or entity. It is not a substitute for professional advice or services. Any actions you take based on the information provided here are strictly at your own risk. You accept full responsibility for any decisions or outcomes arising from your use of this website and agree to release us from any liability in connection with your use of, or reliance upon, the content or products found herein.