
|
United Urban Investment Corporation (8960.T) DCF -Bewertung |
Fully Editable: Tailor To Your Needs In Excel Or Sheets
Professional Design: Trusted, Industry-Standard Templates
Investor-Approved Valuation Models
MAC/PC Compatible, Fully Unlocked
No Expertise Is Needed; Easy To Follow
United Urban Investment Corporation (8960.T) Bundle
Optimieren Sie Ihre Analyse und verbessern Sie die Präzision mit unserem DCF -Taschenrechner (8960T)! Durch die Verwendung realer Daten der United Urban Investment Corporation sowie anpassbare Annahmen können Sie dieses Tool wie ein erfahrener Investor prognostizieren, analysieren und value (Unternehmen) prognostizieren, analysieren und value.
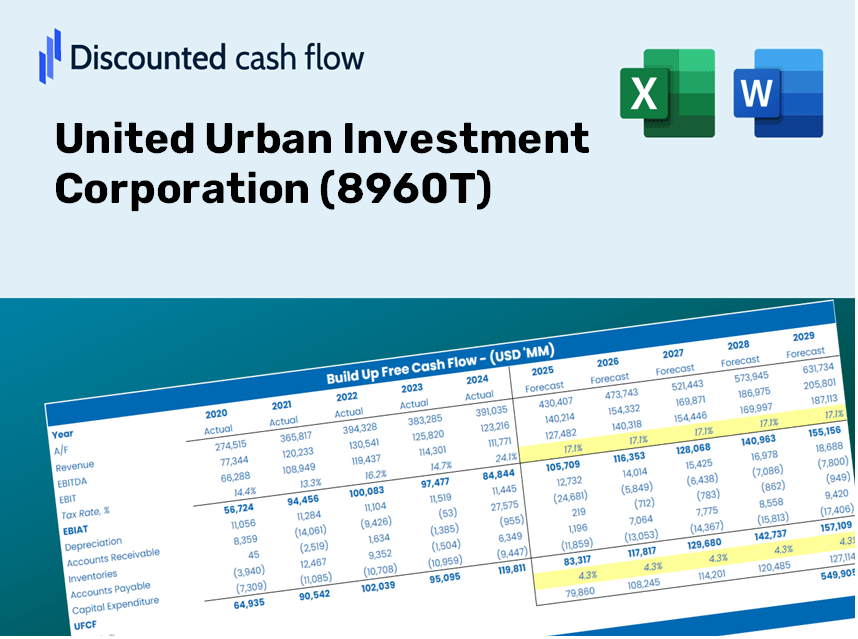
Discounted Cash Flow (DCF) - (USD MM)
| Year | AY1 2020 |
AY2 2021 |
AY3 2022 |
AY4 2023 |
AY5 2024 |
FY1 2025 |
FY2 2026 |
FY3 2027 |
FY4 2028 |
FY5 2029 |
|---|---|---|---|---|---|---|---|---|---|---|
| Revenue | 47,510.4 | 47,005.7 | 48,618.0 | 50,409.3 | 54,191.3 | 56,027.7 | 57,926.4 | 59,889.3 | 61,918.8 | 64,017.0 |
| Revenue Growth, % | 0 | -1.06 | 3.43 | 3.68 | 7.5 | 3.39 | 3.39 | 3.39 | 3.39 | 3.39 |
| EBITDA | 29,542.5 | 28,418.1 | 29,419.6 | 30,410.4 | 34,195.2 | 34,353.7 | 35,517.8 | 36,721.4 | 37,965.8 | 39,252.4 |
| EBITDA, % | 62.18 | 60.46 | 60.51 | 60.33 | 63.1 | 61.32 | 61.32 | 61.32 | 61.32 | 61.32 |
| Depreciation | 8,275.5 | 8,228.3 | 8,170.9 | 8,136.6 | 8,046.1 | 9,269.0 | 9,583.1 | 9,907.9 | 10,243.6 | 10,590.7 |
| Depreciation, % | 17.42 | 17.5 | 16.81 | 16.14 | 14.85 | 16.54 | 16.54 | 16.54 | 16.54 | 16.54 |
| EBIT | 21,267.0 | 20,189.8 | 21,248.7 | 22,273.9 | 26,149.1 | 25,084.7 | 25,934.7 | 26,813.6 | 27,722.2 | 28,661.6 |
| EBIT, % | 44.76 | 42.95 | 43.71 | 44.19 | 48.25 | 44.77 | 44.77 | 44.77 | 44.77 | 44.77 |
| Total Cash | 41,859.9 | 31,251.6 | 31,999.5 | 36,007.0 | 27,058.3 | 38,297.2 | 39,595.0 | 40,936.8 | 42,324.0 | 43,758.2 |
| Total Cash, percent | .0 | .0 | .0 | .0 | .0 | .0 | .0 | .0 | .0 | .0 |
| Account Receivables | 535.7 | 526.3 | 582.0 | 541.1 | 666.5 | 644.0 | 665.9 | 688.4 | 711.7 | 735.9 |
| Account Receivables, % | 1.13 | 1.12 | 1.2 | 1.07 | 1.23 | 1.15 | 1.15 | 1.15 | 1.15 | 1.15 |
| Inventories | 23,856.8 | .0 | 27,144.4 | .0 | .0 | 11,883.0 | 12,285.7 | 12,702.0 | 13,132.5 | 13,577.5 |
| Inventories, % | 50.21 | 0 | 55.83 | 0 | 0 | 21.21 | 21.21 | 21.21 | 21.21 | 21.21 |
| Accounts Payable | 2,445.1 | 2,997.7 | 2,669.3 | 3,107.0 | 2,696.7 | 3,154.8 | 3,261.7 | 3,372.2 | 3,486.5 | 3,604.7 |
| Accounts Payable, % | 5.15 | 6.38 | 5.49 | 6.16 | 4.98 | 5.63 | 5.63 | 5.63 | 5.63 | 5.63 |
| Capital Expenditure | -34,428.4 | -36,055.1 | -18,541.9 | -16,635.1 | -41,339.2 | -33,234.6 | -34,360.8 | -35,525.2 | -36,729.1 | -37,973.7 |
| Capital Expenditure, % | -72.46 | -76.7 | -38.14 | -33 | -76.28 | -59.32 | -59.32 | -59.32 | -59.32 | -59.32 |
| Tax Rate, % | 0.00507313 | 0.00507313 | 0.00507313 | 0.00507313 | 0.00507313 | 0.00507313 | 0.00507313 | 0.00507313 | 0.00507313 | 0.00507313 |
| EBITAT | 21,265.7 | 20,188.3 | 21,247.3 | 22,272.5 | 26,147.8 | 25,083.1 | 25,933.1 | 26,811.9 | 27,720.5 | 28,659.9 |
| Depreciation | ||||||||||
| Changes in Account Receivables | ||||||||||
| Changes in Inventories | ||||||||||
| Changes in Accounts Payable | ||||||||||
| Capital Expenditure | ||||||||||
| UFCF | -26,834.5 | 16,780.3 | -16,652.1 | 41,396.9 | -7,681.1 | -10,284.9 | 837.8 | 866.2 | 895.6 | 925.9 |
| WACC, % | 4.35 | 4.35 | 4.35 | 4.35 | 4.35 | 4.35 | 4.35 | 4.35 | 4.35 | 4.35 |
| PV UFCF | ||||||||||
| SUM PV UFCF | -6,820.8 | |||||||||
| Long Term Growth Rate, % | 2.00 | |||||||||
| Free cash flow (T + 1) | 944 | |||||||||
| Terminal Value | 40,183 | |||||||||
| Present Terminal Value | 32,477 | |||||||||
| Enterprise Value | 25,657 | |||||||||
| Net Debt | 301,695 | |||||||||
| Equity Value | -276,038 | |||||||||
| Diluted Shares Outstanding, MM | 3 | |||||||||
| Equity Value Per Share | -89,429.71 |
Benefits of Choosing Us
- Pre-Configured Financial Model: Utilize United Urban Investment Corporation's (8960T) real data for accurate DCF valuations.
- Comprehensive Forecast Management: Modify revenue growth rates, profit margins, WACC, and other essential parameters.
- Real-Time Calculations: Automatic updates provide immediate results as you adjust your inputs.
- Professional-Grade Template: A polished Excel file tailored for high-quality financial evaluations.
- Flexible and Reusable: Designed for adaptability, perfect for multiple detailed forecasting scenarios.
Key Features
- Pre-Loaded Data: United Urban Investment Corporation's historical financial reports and pre-filled forecasts.
- Fully Adjustable Inputs: Modify WACC, tax rates, revenue growth, and EBITDA margins as needed.
- Instant Results: View UUI's intrinsic value recalculated in real time.
- Clear Visual Outputs: Dashboard charts present valuation results and essential metrics.
- Built for Accuracy: A professional-grade tool designed for analysts, investors, and finance professionals.
How It Functions
- 1. Access the Template: Download and open the Excel file containing United Urban Investment Corporation’s preloaded data.
- 2. Modify Assumptions: Adjust key parameters such as growth rates, WACC, and capital expenditures.
- 3. Instant Results: The DCF model automatically computes intrinsic value and NPV for you.
- 4. Explore Scenarios: Evaluate various forecasts to assess different valuation results.
- 5. Utilize with Assurance: Present expert valuation analyses to bolster your decision-making process.
Why Choose This Calculator for United Urban Investment Corporation (8960T)?
- Designed for Experts: A sophisticated tool utilized by analysts, CFOs, and investment advisors.
- Accurate Financials: United Urban's historical and projected data preloaded for precise analysis.
- Flexible Scenario Analysis: Effortlessly simulate various forecasts and assumptions.
- Insightful Results: Automatically computes intrinsic value, NPV, and essential metrics.
- User-Friendly: Simple step-by-step instructions to navigate the calculation process.
Who Can Benefit from This Product?
- Investors: Effectively assess United Urban Investment Corporation’s fair value before making investment choices.
- CFOs: Utilize a high-quality DCF model for accurate financial reporting and analysis.
- Consultants: Seamlessly customize the template for client valuation reports.
- Entrepreneurs: Acquire valuable insights into the financial modeling practices of leading corporations.
- Educators: Implement it as a resource to teach valuation techniques and methodologies.
What the Template Includes
- Historical Data: Contains United Urban Investment Corporation's past financial information and foundational forecasts.
- DCF and Levered DCF Models: Comprehensive templates to determine the intrinsic value of United Urban Investment Corporation (8960T).
- WACC Sheet: Pre-configured calculations for the Weighted Average Cost of Capital.
- Editable Inputs: Adjust key metrics such as growth rates, EBITDA %, and CAPEX assumptions.
- Quarterly and Annual Statements: A thorough analysis of United Urban Investment Corporation's financial performance.
- Interactive Dashboard: Dynamically visualize valuation outcomes and future projections.
Disclaimer
All information, articles, and product details provided on this website are for general informational and educational purposes only. We do not claim any ownership over, nor do we intend to infringe upon, any trademarks, copyrights, logos, brand names, or other intellectual property mentioned or depicted on this site. Such intellectual property remains the property of its respective owners, and any references here are made solely for identification or informational purposes, without implying any affiliation, endorsement, or partnership.
We make no representations or warranties, express or implied, regarding the accuracy, completeness, or suitability of any content or products presented. Nothing on this website should be construed as legal, tax, investment, financial, medical, or other professional advice. In addition, no part of this site—including articles or product references—constitutes a solicitation, recommendation, endorsement, advertisement, or offer to buy or sell any securities, franchises, or other financial instruments, particularly in jurisdictions where such activity would be unlawful.
All content is of a general nature and may not address the specific circumstances of any individual or entity. It is not a substitute for professional advice or services. Any actions you take based on the information provided here are strictly at your own risk. You accept full responsibility for any decisions or outcomes arising from your use of this website and agree to release us from any liability in connection with your use of, or reliance upon, the content or products found herein.