
|
ICHIGO Office REIT Investment Corporation (8975.t) DCF -Bewertung |
Fully Editable: Tailor To Your Needs In Excel Or Sheets
Professional Design: Trusted, Industry-Standard Templates
Investor-Approved Valuation Models
MAC/PC Compatible, Fully Unlocked
No Expertise Is Needed; Easy To Follow
Ichigo Office REIT Investment Corporation (8975.T) Bundle
Erforschen Sie das finanzielle Potenzial der ICHIGO Office REIT Investment Corporation (8975T) mit unserem benutzerfreundlichen DCF-Taschenrechner! Geben Sie Ihre Annahmen in Bezug auf Wachstum, Margen und Kosten für die Berechnung des inneren Werts der ICHIGO Office REIT Investment Corporation (8975T) ein und verbessern Sie Ihre Anlagestrategie.
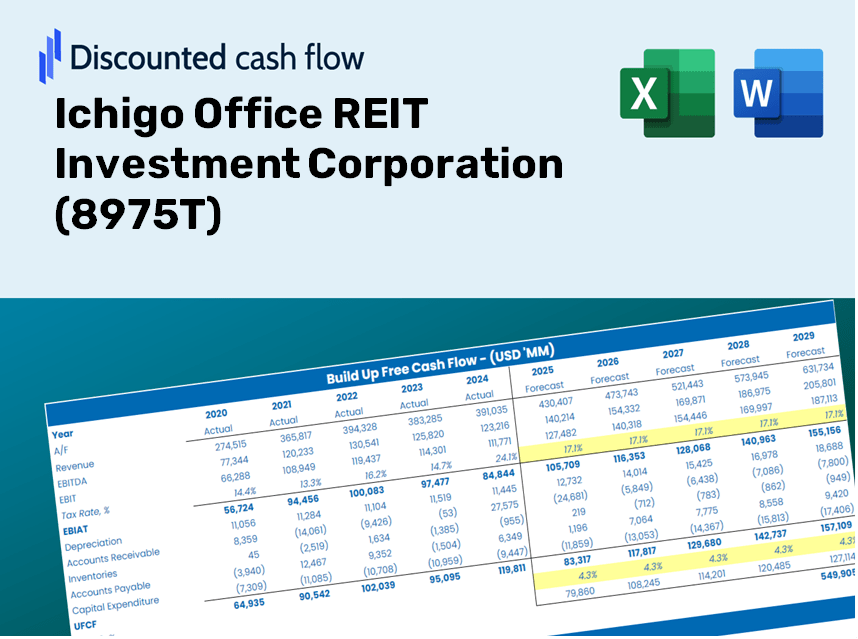
Discounted Cash Flow (DCF) - (USD MM)
| Year | AY1 2020 |
AY2 2021 |
AY3 2022 |
AY4 2023 |
AY5 2024 |
FY1 2025 |
FY2 2026 |
FY3 2027 |
FY4 2028 |
FY5 2029 |
|---|---|---|---|---|---|---|---|---|---|---|
| Revenue | 16,124.3 | 15,569.0 | 16,476.4 | 20,294.7 | 17,291.4 | 17,756.6 | 18,234.2 | 18,724.8 | 19,228.5 | 19,745.7 |
| Revenue Growth, % | 0 | -3.44 | 5.83 | 23.17 | -14.8 | 2.69 | 2.69 | 2.69 | 2.69 | 2.69 |
| EBITDA | 10,151.4 | 9,644.0 | 10,016.4 | 13,026.9 | 10,482.3 | 11,026.9 | 11,323.5 | 11,628.2 | 11,941.0 | 12,262.2 |
| EBITDA, % | 62.96 | 61.94 | 60.79 | 64.19 | 60.62 | 62.1 | 62.1 | 62.1 | 62.1 | 62.1 |
| Depreciation | 1,677.4 | 1,757.9 | 1,804.0 | 1,922.6 | 1,962.9 | 1,898.8 | 1,949.9 | 2,002.3 | 2,056.2 | 2,111.5 |
| Depreciation, % | 10.4 | 11.29 | 10.95 | 9.47 | 11.35 | 10.69 | 10.69 | 10.69 | 10.69 | 10.69 |
| EBIT | 8,474.0 | 7,886.1 | 8,212.4 | 11,104.3 | 8,519.4 | 9,128.1 | 9,373.7 | 9,625.8 | 9,884.8 | 10,150.7 |
| EBIT, % | 52.55 | 50.65 | 49.84 | 54.72 | 49.27 | 51.41 | 51.41 | 51.41 | 51.41 | 51.41 |
| Total Cash | 12,255.7 | 9,421.0 | 8,697.1 | 6,485.0 | 6,858.4 | 9,266.2 | 9,515.4 | 9,771.4 | 10,034.3 | 10,304.2 |
| Total Cash, percent | .0 | .0 | .0 | .0 | .0 | .0 | .0 | .0 | .0 | .0 |
| Account Receivables | 30.9 | 17.6 | 8.9 | 9.5 | 31.4 | 20.9 | 21.4 | 22.0 | 22.6 | 23.2 |
| Account Receivables, % | 0.19178 | 0.11304 | 0.05387084 | 0.04685952 | 0.18158 | 0.11742 | 0.11742 | 0.11742 | 0.11742 | 0.11742 |
| Inventories | 14,347.1 | 14,408.1 | .0 | -8.6 | -165.5 | 6,410.9 | 6,583.4 | 6,760.5 | 6,942.3 | 7,129.1 |
| Inventories, % | 88.98 | 92.54 | 0 | -0.04226719 | -0.95704 | 36.1 | 36.1 | 36.1 | 36.1 | 36.1 |
| Accounts Payable | 677.6 | 608.9 | 575.4 | 805.2 | 1,082.3 | 775.3 | 796.2 | 817.6 | 839.6 | 862.2 |
| Accounts Payable, % | 4.2 | 3.91 | 3.49 | 3.97 | 6.26 | 4.37 | 4.37 | 4.37 | 4.37 | 4.37 |
| Capital Expenditure | -2,704.4 | -5,176.6 | -5,249.2 | -11,478.7 | -17,508.8 | -8,467.8 | -8,695.6 | -8,929.5 | -9,169.7 | -9,416.4 |
| Capital Expenditure, % | -16.77 | -33.25 | -31.86 | -56.56 | -101.26 | -47.69 | -47.69 | -47.69 | -47.69 | -47.69 |
| Tax Rate, % | 0.01633859 | 0.01633859 | 0.01633859 | 0.01633859 | 0.01633859 | 0.01633859 | 0.01633859 | 0.01633859 | 0.01633859 | 0.01633859 |
| EBITAT | 8,472.5 | 7,884.6 | 8,210.9 | 11,102.9 | 8,518.0 | 9,126.6 | 9,372.1 | 9,624.2 | 9,883.1 | 10,149.0 |
| Depreciation | ||||||||||
| Changes in Account Receivables | ||||||||||
| Changes in Inventories | ||||||||||
| Changes in Accounts Payable | ||||||||||
| Capital Expenditure | ||||||||||
| UFCF | -6,255.0 | 4,349.5 | 19,149.0 | 1,784.4 | -6,615.8 | -4,315.2 | 2,474.2 | 2,540.8 | 2,609.1 | 2,679.3 |
| WACC, % | 4.13 | 4.13 | 4.13 | 4.13 | 4.13 | 4.13 | 4.13 | 4.13 | 4.13 | 4.13 |
| PV UFCF | ||||||||||
| SUM PV UFCF | 4,794.5 | |||||||||
| Long Term Growth Rate, % | 2.00 | |||||||||
| Free cash flow (T + 1) | 2,733 | |||||||||
| Terminal Value | 128,026 | |||||||||
| Present Terminal Value | 104,549 | |||||||||
| Enterprise Value | 109,344 | |||||||||
| Net Debt | 116,899 | |||||||||
| Equity Value | -7,555 | |||||||||
| Diluted Shares Outstanding, MM | 2 | |||||||||
| Equity Value Per Share | -4,934.61 |
Benefits You Will Receive
- Customizable Excel Template: A fully adaptable Excel-based DCF Calculator featuring pre-filled financial data for Ichigo Office REIT Investment Corporation (8975T).
- Accurate Market Data: Access to historical financial information and projected estimates (highlighted in the yellow cells).
- Flexible Forecasting: Adjust key assumptions such as revenue growth, EBITDA percentage, and WACC.
- Instant Calculations: Quickly observe how your inputs influence the valuation of Ichigo Office REIT Investment Corporation (8975T).
- Professional Tool: Designed for investors, CFOs, consultants, and financial analysts.
- Intuitive User Interface: Organized for straightforward navigation and ease of use, complete with step-by-step guidance.
Key Features
- Customizable Financial Inputs: Adjust essential parameters such as rental income growth, operating expenses, and capital improvements.
- Instant DCF Valuation: Quickly computes intrinsic value, net present value, and other financial metrics.
- High Precision Analysis: Leverages Ichigo Office REIT’s actual financial data for accurate valuation results.
- Effortless Scenario Evaluation: Easily explore various scenarios and assess different outcomes side by side.
- Efficiency Booster: Streamlines the valuation process, eliminating the need for intricate models from the ground up.
How It Operates
- Download: Get the pre-prepared Excel file containing Ichigo Office REIT Investment Corporation’s financial metrics.
- Customize: Modify forecasts such as rental income growth, net operating income %, and cap rates.
- Update Automatically: The intrinsic value and NPV figures refresh in real-time.
- Evaluate Scenarios: Generate various projections and compare results seamlessly.
- Make Decisions: Utilize the valuation insights to inform your investment strategy for (8975T).
Why Choose the Ichigo Office REIT Investment Corporation ([8975T]) Calculator?
- Reliable Data: Utilize accurate financial information to ensure trustworthy valuation outcomes.
- Flexible Options: Modify essential parameters such as growth rates, WACC, and tax rates to align with your forecasts.
- Efficiency Boost: Pre-defined calculations save you the hassle of starting from the ground up.
- Professional Tool: Tailored for investors, analysts, and real estate professionals.
- User-Centric: Designed with an intuitive interface and clear, step-by-step guidance for all users.
Who Can Benefit from This Product?
- Institutional Investors: Develop comprehensive and trustworthy valuation models for portfolio assessments related to Ichigo Office REIT Investment Corporation (8975T).
- Real Estate Finance Teams: Evaluate different valuation scenarios to inform internal strategies and decisions.
- Consultants and Financial Advisors: Deliver precise valuation insights for clients interested in Ichigo Office REIT Investment Corporation (8975T).
- Academics and Students: Utilize real market data to enhance their understanding and instruction of financial modeling.
- Real Estate Enthusiasts: Gain insights into how REITs like Ichigo Office REIT Investment Corporation (8975T) are appraised in the market.
Contents of the Template
- Preloaded Ichigo Office REIT Data: Historical and projected financial metrics, including rental income, net operating income, and capital expenditures.
- DCF and WACC Models: Advanced sheets designed for calculating intrinsic value and Weighted Average Cost of Capital.
- Customizable Inputs: Yellow-highlighted cells for modifying rental growth rates, tax assumptions, and discount rates.
- Financial Statements: Detailed annual and quarterly financial reports for comprehensive analysis.
- Key Ratios: Metrics for profitability, leverage, and efficiency to assess performance.
- Dashboard and Charts: Visual representations of valuation results and key assumptions.
Disclaimer
All information, articles, and product details provided on this website are for general informational and educational purposes only. We do not claim any ownership over, nor do we intend to infringe upon, any trademarks, copyrights, logos, brand names, or other intellectual property mentioned or depicted on this site. Such intellectual property remains the property of its respective owners, and any references here are made solely for identification or informational purposes, without implying any affiliation, endorsement, or partnership.
We make no representations or warranties, express or implied, regarding the accuracy, completeness, or suitability of any content or products presented. Nothing on this website should be construed as legal, tax, investment, financial, medical, or other professional advice. In addition, no part of this site—including articles or product references—constitutes a solicitation, recommendation, endorsement, advertisement, or offer to buy or sell any securities, franchises, or other financial instruments, particularly in jurisdictions where such activity would be unlawful.
All content is of a general nature and may not address the specific circumstances of any individual or entity. It is not a substitute for professional advice or services. Any actions you take based on the information provided here are strictly at your own risk. You accept full responsibility for any decisions or outcomes arising from your use of this website and agree to release us from any liability in connection with your use of, or reliance upon, the content or products found herein.