
|
Sotetsu Holdings, Inc. (9003.T) DCF -Bewertung |
Fully Editable: Tailor To Your Needs In Excel Or Sheets
Professional Design: Trusted, Industry-Standard Templates
Investor-Approved Valuation Models
MAC/PC Compatible, Fully Unlocked
No Expertise Is Needed; Easy To Follow
Sotetsu Holdings, Inc. (9003.T) Bundle
Unser (9003T) DCF-Taschenrechner entwickelt für die Genauigkeit und ermöglicht es Ihnen, Sotetsu Holdings, Inc. unter Verwendung realer Finanzdaten zu bewerten, und bietet vollständige Flexibilität, um alle wesentlichen Parameter für erweiterte Projektionen zu ändern.
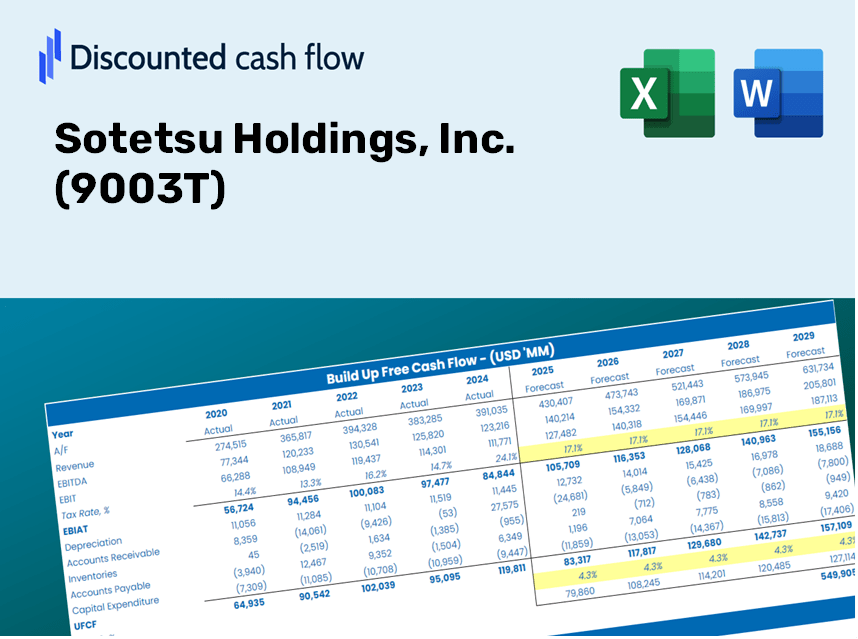
Discounted Cash Flow (DCF) - (USD MM)
| Year | AY1 2020 |
AY2 2021 |
AY3 2022 |
AY4 2023 |
AY5 2024 |
FY1 2025 |
FY2 2026 |
FY3 2027 |
FY4 2028 |
FY5 2029 |
|---|---|---|---|---|---|---|---|---|---|---|
| Revenue | 221,136.0 | 216,684.0 | 249,667.0 | 270,039.0 | 292,178.0 | 293,161.6 | 294,148.4 | 295,138.6 | 296,132.2 | 297,129.0 |
| Revenue Growth, % | 0 | -2.01 | 15.22 | 8.16 | 8.2 | 0.33663 | 0.33663 | 0.33663 | 0.33663 | 0.33663 |
| EBITDA | 11,853.0 | 28,165.0 | 37,028.0 | 51,793.0 | 58,582.0 | 42,461.0 | 42,603.9 | 42,747.4 | 42,891.3 | 43,035.7 |
| EBITDA, % | 5.36 | 13 | 14.83 | 19.18 | 20.05 | 14.48 | 14.48 | 14.48 | 14.48 | 14.48 |
| Depreciation | 21,092.0 | 21,843.0 | 22,457.0 | 24,065.0 | 24,755.0 | 26,969.5 | 27,060.3 | 27,151.4 | 27,242.8 | 27,334.5 |
| Depreciation, % | 9.54 | 10.08 | 8.99 | 8.91 | 8.47 | 9.2 | 9.2 | 9.2 | 9.2 | 9.2 |
| EBIT | -9,239.0 | 6,322.0 | 14,571.0 | 27,728.0 | 33,827.0 | 15,491.5 | 15,543.7 | 15,596.0 | 15,648.5 | 15,701.2 |
| EBIT, % | -4.18 | 2.92 | 5.84 | 10.27 | 11.58 | 5.28 | 5.28 | 5.28 | 5.28 | 5.28 |
| Total Cash | 23,675.0 | 22,040.0 | 20,156.0 | 27,549.0 | 31,576.0 | 29,292.5 | 29,391.1 | 29,490.1 | 29,589.3 | 29,689.0 |
| Total Cash, percent | .0 | .0 | .0 | .0 | .0 | .0 | .0 | .0 | .0 | .0 |
| Account Receivables | 9,437.0 | 12,487.0 | 12,445.0 | 21,395.0 | 15,912.0 | 16,642.1 | 16,698.1 | 16,754.3 | 16,810.7 | 16,867.3 |
| Account Receivables, % | 4.27 | 5.76 | 4.98 | 7.92 | 5.45 | 5.68 | 5.68 | 5.68 | 5.68 | 5.68 |
| Inventories | 25,026.0 | 22,165.0 | 28,600.0 | 38,747.0 | 79,531.0 | 43,722.2 | 43,869.4 | 44,017.1 | 44,165.3 | 44,313.9 |
| Inventories, % | 11.32 | 10.23 | 11.46 | 14.35 | 27.22 | 14.91 | 14.91 | 14.91 | 14.91 | 14.91 |
| Accounts Payable | 7,693.0 | 6,433.0 | 9,307.0 | 8,194.0 | 8,967.0 | 9,544.7 | 9,576.8 | 9,609.0 | 9,641.4 | 9,673.8 |
| Accounts Payable, % | 3.48 | 2.97 | 3.73 | 3.03 | 3.07 | 3.26 | 3.26 | 3.26 | 3.26 | 3.26 |
| Capital Expenditure | -54,415.0 | -47,070.0 | -31,954.0 | -56,773.0 | -41,752.0 | -55,373.8 | -55,560.2 | -55,747.2 | -55,934.9 | -56,123.2 |
| Capital Expenditure, % | -24.61 | -21.72 | -12.8 | -21.02 | -14.29 | -18.89 | -18.89 | -18.89 | -18.89 | -18.89 |
| Tax Rate, % | 26.59 | 26.59 | 26.59 | 26.59 | 26.59 | 26.59 | 26.59 | 26.59 | 26.59 | 26.59 |
| EBITAT | -10,005.3 | 3,199.8 | 8,671.3 | 17,965.4 | 24,832.5 | 10,792.2 | 10,828.6 | 10,865.0 | 10,901.6 | 10,938.3 |
| Depreciation | ||||||||||
| Changes in Account Receivables | ||||||||||
| Changes in Inventories | ||||||||||
| Changes in Accounts Payable | ||||||||||
| Capital Expenditure | ||||||||||
| UFCF | -70,098.3 | -23,476.2 | -4,344.7 | -34,952.6 | -26,692.5 | 18,044.2 | -17,842.5 | -17,902.5 | -17,962.8 | -18,023.3 |
| WACC, % | 4.49 | 3.34 | 3.54 | 3.67 | 3.87 | 3.78 | 3.78 | 3.78 | 3.78 | 3.78 |
| PV UFCF | ||||||||||
| SUM PV UFCF | -45,652.8 | |||||||||
| Long Term Growth Rate, % | 1.00 | |||||||||
| Free cash flow (T + 1) | -18,204 | |||||||||
| Terminal Value | -654,791 | |||||||||
| Present Terminal Value | -543,918 | |||||||||
| Enterprise Value | -589,570 | |||||||||
| Net Debt | 416,915 | |||||||||
| Equity Value | -1,006,485 | |||||||||
| Diluted Shares Outstanding, MM | 98 | |||||||||
| Equity Value Per Share | -10,278.76 |
What You Will Receive
- Authentic 9003T Financial Data: Pre-filled with Sotetsu Holdings' historical and forecasted figures for accurate analysis.
- Completely Customizable Template: Easily adjust key inputs such as revenue growth, WACC, and EBITDA %.
- Instant Calculations: Watch Sotetsu Holdings' intrinsic value refresh immediately based on your modifications.
- Professional Valuation Tool: Tailored for investors, analysts, and consultants aiming for precise DCF results.
- User-Friendly Interface: Intuitive layout and straightforward guidance suitable for all skill levels.
Key Features
- Authentic Sotetsu Financials: Access reliable pre-loaded historical data and future estimates.
- Adjustable Forecast Variables: Modify yellow-highlighted cells for metrics such as WACC, growth rates, and profit margins.
- Real-time Calculations: Automatic updates for DCF, Net Present Value (NPV), and cash flow evaluations.
- Interactive Dashboard: User-friendly charts and summaries to illustrate your valuation findings.
- Suitable for All Skill Levels: An intuitive design tailored for investors, CFOs, and consultants alike.
How It Functions
- Step 1: Download the Excel spreadsheet.
- Step 2: Examine Sotetsu Holdings, Inc.'s pre-filled financial data and projections.
- Step 3: Adjust key inputs such as revenue growth, WACC, and tax rates (highlighted cells).
- Step 4: Observe the DCF model refresh in real-time as you modify your assumptions.
- Step 5: Evaluate the results and utilize them for your investment strategies.
Why Opt for This Calculator?
- Precision: Utilizes the most current Sotetsu Holdings, Inc. (9003T) financial data to ensure accuracy.
- Versatility: Built to allow users to adjust and experiment with inputs at their discretion.
- Efficiency: Eliminate the complexity of creating a DCF model from the ground up.
- Expert-Level: Crafted with the expertise and usability standards expected at the CFO level.
- Accessible: Intuitive interface designed for users of all skill levels, including those new to financial modeling.
Who Can Benefit from Sotetsu Holdings, Inc. (9003T)?
- Investors: Examine the valuation of Sotetsu Holdings, Inc. (9003T) before making stock transactions.
- CFOs and Financial Analysts: Optimize valuation procedures and validate financial forecasts.
- Startup Founders: Gain insights into how large public companies like Sotetsu Holdings, Inc. (9003T) are valued.
- Consultants: Create comprehensive valuation reports for your clients based on Sotetsu Holdings, Inc. (9003T).
- Students and Educators: Utilize actual market data to learn and teach valuation methods effectively.
Components of the Template
- Pre-Filled DCF Model: Sotetsu Holdings, Inc. (9003T) financial data ready for immediate analysis.
- WACC Calculator: Comprehensive calculations for Weighted Average Cost of Capital.
- Financial Ratios: Assess Sotetsu’s profitability, leverage, and operational efficiency.
- Editable Inputs: Adjust assumptions such as growth rates, margins, and capital expenditures to align with your scenarios.
- Financial Statements: Annual and quarterly reports to facilitate in-depth examination.
- Interactive Dashboard: Effortlessly visualize essential valuation metrics and outcomes.
Disclaimer
All information, articles, and product details provided on this website are for general informational and educational purposes only. We do not claim any ownership over, nor do we intend to infringe upon, any trademarks, copyrights, logos, brand names, or other intellectual property mentioned or depicted on this site. Such intellectual property remains the property of its respective owners, and any references here are made solely for identification or informational purposes, without implying any affiliation, endorsement, or partnership.
We make no representations or warranties, express or implied, regarding the accuracy, completeness, or suitability of any content or products presented. Nothing on this website should be construed as legal, tax, investment, financial, medical, or other professional advice. In addition, no part of this site—including articles or product references—constitutes a solicitation, recommendation, endorsement, advertisement, or offer to buy or sell any securities, franchises, or other financial instruments, particularly in jurisdictions where such activity would be unlawful.
All content is of a general nature and may not address the specific circumstances of any individual or entity. It is not a substitute for professional advice or services. Any actions you take based on the information provided here are strictly at your own risk. You accept full responsibility for any decisions or outcomes arising from your use of this website and agree to release us from any liability in connection with your use of, or reliance upon, the content or products found herein.