
|
East Japan Railway Company (9020.T) DCF -Bewertung |
Fully Editable: Tailor To Your Needs In Excel Or Sheets
Professional Design: Trusted, Industry-Standard Templates
Investor-Approved Valuation Models
MAC/PC Compatible, Fully Unlocked
No Expertise Is Needed; Easy To Follow
East Japan Railway Company (9020.T) Bundle
Vereinfachen Sie mit diesem anpassbaren DCF -Taschenrechner! Mit der Real East Japan Railway Company (9020T) -Befinanzierungen und einstellbaren Prognoseeingaben können Sie die Szenarien testen und das Fair -Wert der East Japan Railway Company (9020T) in Minuten aufdecken.
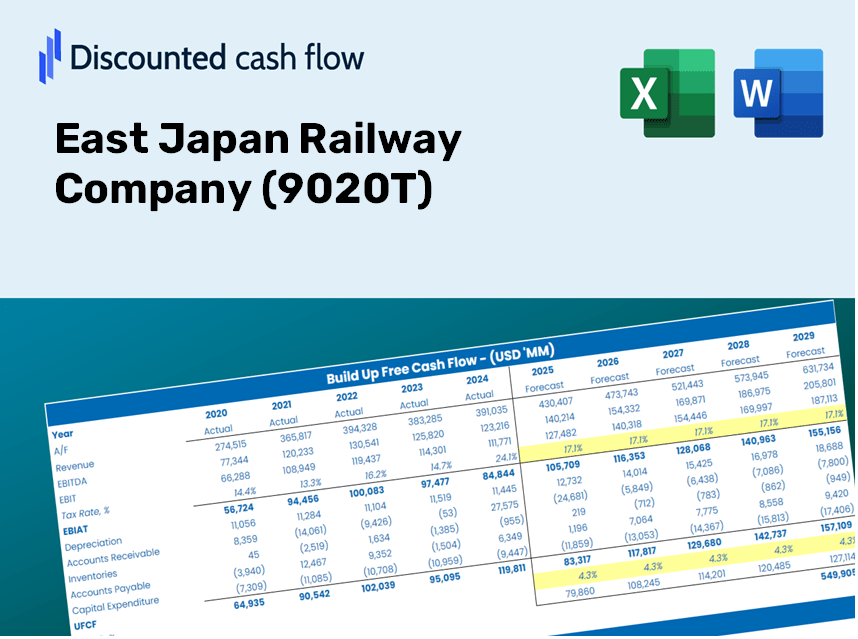
Discounted Cash Flow (DCF) - (USD MM)
| Year | AY1 2021 |
AY2 2022 |
AY3 2023 |
AY4 2024 |
AY5 2025 |
FY1 2026 |
FY2 2027 |
FY3 2028 |
FY4 2029 |
FY5 2030 |
|---|---|---|---|---|---|---|---|---|---|---|
| Revenue | 1,764,584.0 | 1,978,967.0 | 2,405,538.0 | 2,730,118.0 | 2,887,553.0 | 2,851,563.9 | 2,816,023.3 | 2,780,925.6 | 2,746,265.4 | 2,712,037.2 |
| Revenue Growth, % | 0 | 12.15 | 21.56 | 13.49 | 5.77 | -1.25 | -1.25 | -1.25 | -1.25 | -1.25 |
| EBITDA | -242,931.0 | 285,582.0 | 592,665.0 | 747,538.0 | 790,982.0 | 456,679.8 | 450,987.9 | 445,367.0 | 439,816.2 | 434,334.5 |
| EBITDA, % | -13.77 | 14.43 | 24.64 | 27.38 | 27.39 | 16.02 | 16.02 | 16.02 | 16.02 | 16.02 |
| Depreciation | 399,998.0 | 403,925.0 | 400,535.0 | 403,290.0 | 418,865.0 | 507,620.2 | 501,293.4 | 495,045.5 | 488,875.5 | 482,782.4 |
| Depreciation, % | 22.67 | 20.41 | 16.65 | 14.77 | 14.51 | 17.8 | 17.8 | 17.8 | 17.8 | 17.8 |
| EBIT | -642,929.0 | -118,343.0 | 192,130.0 | 344,248.0 | 372,117.0 | -50,940.4 | -50,305.5 | -49,678.5 | -49,059.3 | -48,447.9 |
| EBIT, % | -36.44 | -5.98 | 7.99 | 12.61 | 12.89 | -1.79 | -1.79 | -1.79 | -1.79 | -1.79 |
| Total Cash | 198,267.0 | 171,294.0 | 215,193.0 | 281,000.0 | 233,673.0 | 269,315.3 | 265,958.7 | 262,643.9 | 259,370.4 | 256,137.7 |
| Total Cash, percent | .0 | .0 | .0 | .0 | .0 | .0 | .0 | .0 | .0 | .0 |
| Account Receivables | 506,575.0 | 554,025.0 | 631,879.0 | 705,330.0 | 762,729.0 | 771,181.3 | 761,569.6 | 752,077.8 | 742,704.2 | 733,447.5 |
| Account Receivables, % | 28.71 | 28 | 26.27 | 25.84 | 26.41 | 27.04 | 27.04 | 27.04 | 27.04 | 27.04 |
| Inventories | 83,646.0 | 112,219.0 | 135,668.0 | 138,386.0 | 115,251.0 | 143,210.3 | 141,425.4 | 139,662.8 | 137,922.1 | 136,203.1 |
| Inventories, % | 4.74 | 5.67 | 5.64 | 5.07 | 3.99 | 5.02 | 5.02 | 5.02 | 5.02 | 5.02 |
| Accounts Payable | 52,909.0 | 47,876.0 | 44,250.0 | 47,754.0 | 53,738.0 | 61,977.6 | 61,205.2 | 60,442.4 | 59,689.0 | 58,945.1 |
| Accounts Payable, % | 3 | 2.42 | 1.84 | 1.75 | 1.86 | 2.17 | 2.17 | 2.17 | 2.17 | 2.17 |
| Capital Expenditure | -765,482.0 | -583,055.0 | -555,583.0 | -714,912.0 | -770,933.0 | -848,759.5 | -838,180.9 | -827,734.2 | -817,417.7 | -807,229.8 |
| Capital Expenditure, % | -43.38 | -29.46 | -23.1 | -26.19 | -26.7 | -29.76 | -29.76 | -29.76 | -29.76 | -29.76 |
| Tax Rate, % | 24.56 | 24.56 | 24.56 | 24.56 | 24.56 | 24.56 | 24.56 | 24.56 | 24.56 | 24.56 |
| EBITAT | -528,074.8 | -62,251.0 | 148,513.7 | 246,749.7 | 280,735.0 | -36,591.2 | -36,135.1 | -35,684.8 | -35,240.0 | -34,800.8 |
| Depreciation | ||||||||||
| Changes in Account Receivables | ||||||||||
| Changes in Inventories | ||||||||||
| Changes in Accounts Payable | ||||||||||
| Capital Expenditure | ||||||||||
| UFCF | -1,430,870.8 | -322,437.0 | -111,463.3 | -137,537.3 | -99,613.0 | -405,902.5 | -362,398.6 | -357,881.8 | -353,421.3 | -349,016.4 |
| WACC, % | 4.14 | 3.56 | 4.04 | 3.93 | 4.01 | 3.94 | 3.94 | 3.94 | 3.94 | 3.94 |
| PV UFCF | ||||||||||
| SUM PV UFCF | -1,635,357.6 | |||||||||
| Long Term Growth Rate, % | 3.10 | |||||||||
| Free cash flow (T + 1) | -359,836 | |||||||||
| Terminal Value | -43,055,103 | |||||||||
| Present Terminal Value | -35,497,659 | |||||||||
| Enterprise Value | -37,133,017 | |||||||||
| Net Debt | 4,207,437 | |||||||||
| Equity Value | -41,340,454 | |||||||||
| Diluted Shares Outstanding, MM | 1,131 | |||||||||
| Equity Value Per Share | -36,548.22 |
Benefits You Will Receive
- Accurate JR East Financial Data: Pre-loaded with East Japan Railway Company's historical and projected data for thorough analysis.
- Completely Customizable Template: Easily adjust essential inputs such as revenue growth, WACC, and EBITDA percentage.
- Real-Time Calculations: Watch as the intrinsic value of JR East (9020T) updates automatically with your modifications.
- Expert Valuation Tool: Tailored for investors, analysts, and consultants aiming for precise DCF outcomes.
- User-Friendly Interface: Streamlined layout and straightforward guidance suitable for all skill levels.
Key Features
- Pre-Loaded Data: East Japan Railway Company's historical financial statements and pre-filled forecasts.
- Fully Adjustable Inputs: Modify WACC, tax rates, revenue growth, and EBITDA margins as needed.
- Instant Results: View East Japan Railway Company's intrinsic value recalculating in real time.
- Clear Visual Outputs: Dashboard charts present valuation results and essential metrics.
- Built for Accuracy: A professional tool tailored for analysts, investors, and finance professionals.
How It Operates
- Step 1: Download the ready-to-use Excel template featuring data for East Japan Railway Company (9020T).
- Step 2: Review the pre-filled sheets to familiarize yourself with the essential metrics.
- Step 3: Modify the forecasts and assumptions in the editable yellow cells (WACC, growth, margins).
- Step 4: Instantly see the updated results, including East Japan Railway Company’s intrinsic value.
- Step 5: Utilize the outputs to make informed investment choices or create reports.
Reasons to Use This Calculator for East Japan Railway Company (9020T)
- All-in-One Solution: Features DCF, WACC, and financial ratio analyses in a single platform.
- Flexible Inputs: Modify the yellow-highlighted cells to explore different scenarios.
- In-Depth Analysis: Automatically computes East Japan Railway Company’s intrinsic value and Net Present Value.
- Data Ready: Includes both historical and projected data for precise calculations.
- High-Quality Standards: Perfect for financial analysts, investors, and consulting professionals.
Who Should Benefit from This Product?
- Professional Investors: Create comprehensive and trustworthy valuation models for evaluating their portfolios.
- Corporate Finance Teams: Assess valuation scenarios to inform and shape internal strategies.
- Consultants and Advisors: Offer clients precise valuation insights for East Japan Railway Company (9020T) stock.
- Students and Educators: Utilize real-time data to learn and teach financial modeling techniques.
- Transport and Infrastructure Enthusiasts: Gain insights into how transportation companies like East Japan Railway Company (9020T) are valued in the market.
What the Template Contains
- Operating and Balance Sheet Data: Pre-filled historical data and forecasts for East Japan Railway Company (9020T), including revenue, EBITDA, EBIT, and capital expenditures.
- WACC Calculation: A dedicated sheet for the Weighted Average Cost of Capital (WACC), featuring parameters such as Beta, risk-free rate, and share price.
- DCF Valuation (Unlevered and Levered): Editable Discounted Cash Flow models illustrating intrinsic value with comprehensive calculations.
- Financial Statements: Pre-loaded annual and quarterly financial statements to aid in analysis.
- Key Ratios: Includes profitability, leverage, and efficiency ratios specific to East Japan Railway Company (9020T).
- Dashboard and Charts: Visual representation of valuation outputs and assumptions for straightforward result analysis.
Disclaimer
All information, articles, and product details provided on this website are for general informational and educational purposes only. We do not claim any ownership over, nor do we intend to infringe upon, any trademarks, copyrights, logos, brand names, or other intellectual property mentioned or depicted on this site. Such intellectual property remains the property of its respective owners, and any references here are made solely for identification or informational purposes, without implying any affiliation, endorsement, or partnership.
We make no representations or warranties, express or implied, regarding the accuracy, completeness, or suitability of any content or products presented. Nothing on this website should be construed as legal, tax, investment, financial, medical, or other professional advice. In addition, no part of this site—including articles or product references—constitutes a solicitation, recommendation, endorsement, advertisement, or offer to buy or sell any securities, franchises, or other financial instruments, particularly in jurisdictions where such activity would be unlawful.
All content is of a general nature and may not address the specific circumstances of any individual or entity. It is not a substitute for professional advice or services. Any actions you take based on the information provided here are strictly at your own risk. You accept full responsibility for any decisions or outcomes arising from your use of this website and agree to release us from any liability in connection with your use of, or reliance upon, the content or products found herein.