
|
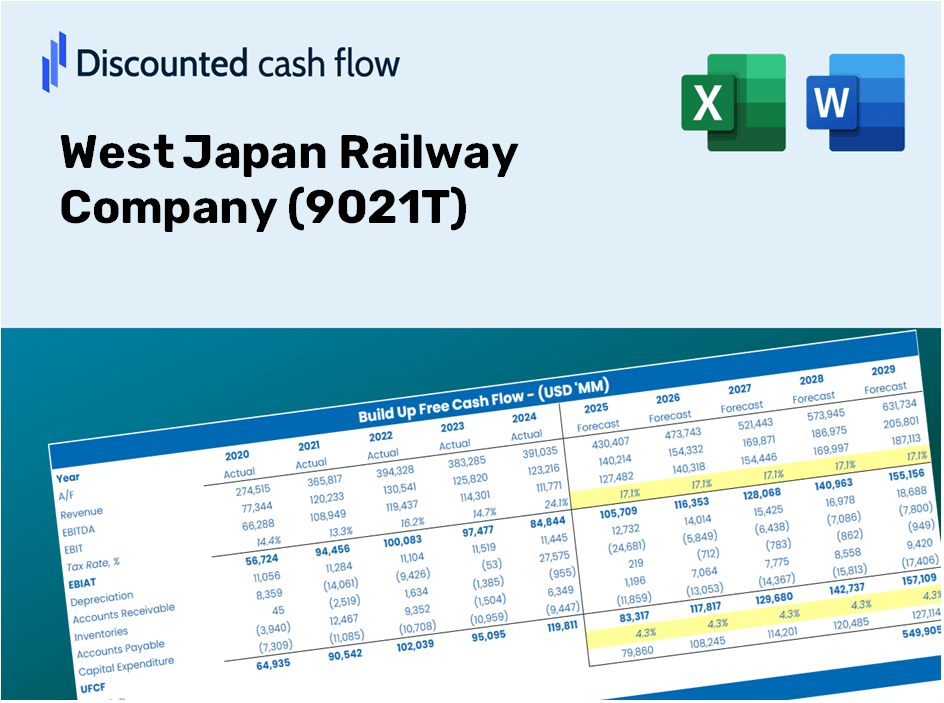
West Japan Railway Company (9021.T) DCF -Bewertung |
Fully Editable: Tailor To Your Needs In Excel Or Sheets
Professional Design: Trusted, Industry-Standard Templates
Investor-Approved Valuation Models
MAC/PC Compatible, Fully Unlocked
No Expertise Is Needed; Easy To Follow
West Japan Railway Company (9021.T) Bundle
Bewerten Sie die finanziellen Aussichten des West Japan Railway Company wie ein Experte! Dieser (9021T) DCF-Taschenrechner bietet vorgefüllte Finanzdaten und vollständige Flexibilität, um das Umsatzwachstum, die WACC, die Gewinnmargen und andere kritische Annahmen zu ändern, um sich an Ihren Projektionen anzupassen.
Discounted Cash Flow (DCF) - (USD MM)
| Year | AY1 2021 |
AY2 2022 |
AY3 2023 |
AY4 2024 |
AY5 2025 |
FY1 2026 |
FY2 2027 |
FY3 2028 |
FY4 2029 |
FY5 2030 |
|---|---|---|---|---|---|---|---|---|---|---|
| Revenue | 898,172.0 | 1,031,103.0 | 1,395,531.0 | 1,635,023.0 | 1,707,944.0 | 2,014,370.4 | 2,375,773.5 | 2,802,016.8 | 3,304,733.4 | 3,897,643.7 |
| Revenue Growth, % | 0 | 14.8 | 35.34 | 17.16 | 4.46 | 17.94 | 17.94 | 17.94 | 17.94 | 17.94 |
| EBITDA | -80,779.0 | 76,745.0 | 253,344.0 | 328,605.0 | 353,350.0 | 231,208.4 | 272,690.0 | 321,614.0 | 379,315.6 | 447,369.5 |
| EBITDA, % | -8.99 | 7.44 | 18.15 | 20.1 | 20.69 | 11.48 | 11.48 | 11.48 | 11.48 | 11.48 |
| Depreciation | 173,468.0 | 160,868.0 | 159,655.0 | 163,322.0 | 169,352.0 | 266,944.2 | 314,837.3 | 371,323.1 | 437,943.0 | 516,515.5 |
| Depreciation, % | 19.31 | 15.6 | 11.44 | 9.99 | 9.92 | 13.25 | 13.25 | 13.25 | 13.25 | 13.25 |
| EBIT | -254,247.0 | -84,123.0 | 93,689.0 | 165,283.0 | 183,998.0 | -35,735.8 | -42,147.3 | -49,709.0 | -58,627.5 | -69,146.0 |
| EBIT, % | -28.31 | -8.16 | 6.71 | 10.11 | 10.77 | -1.77 | -1.77 | -1.77 | -1.77 | -1.77 |
| Total Cash | 210,315.0 | 319,922.0 | 290,174.0 | 233,465.0 | 125,622.0 | 390,265.4 | 460,283.8 | 542,864.5 | 640,261.1 | 755,131.9 |
| Total Cash, percent | .0 | .0 | .0 | .0 | .0 | .0 | .0 | .0 | .0 | .0 |
| Account Receivables | 123,359.0 | 163,338.0 | 199,277.0 | 224,705.0 | 224,387.0 | 284,978.1 | 336,106.7 | 396,408.5 | 467,529.1 | 551,409.6 |
| Account Receivables, % | 13.73 | 15.84 | 14.28 | 13.74 | 13.14 | 14.15 | 14.15 | 14.15 | 14.15 | 14.15 |
| Inventories | 118,899.0 | 145,884.0 | 153,234.0 | 160,631.0 | 181,157.0 | 236,880.6 | 279,380.0 | 329,504.2 | 388,621.4 | 458,344.9 |
| Inventories, % | 13.24 | 14.15 | 10.98 | 9.82 | 10.61 | 11.76 | 11.76 | 11.76 | 11.76 | 11.76 |
| Accounts Payable | 61,564.0 | 58,301.0 | 67,265.0 | 61,221.0 | 67,398.0 | 100,795.6 | 118,879.6 | 140,208.0 | 165,363.1 | 195,031.3 |
| Accounts Payable, % | 6.85 | 5.65 | 4.82 | 3.74 | 3.95 | 5 | 5 | 5 | 5 | 5 |
| Capital Expenditure | -242,047.0 | -240,480.0 | -246,013.0 | -249,352.0 | -283,245.0 | -401,805.3 | -473,894.2 | -558,916.7 | -659,193.3 | -777,460.8 |
| Capital Expenditure, % | -26.95 | -23.32 | -17.63 | -15.25 | -16.58 | -19.95 | -19.95 | -19.95 | -19.95 | -19.95 |
| Tax Rate, % | 30.72 | 30.72 | 30.72 | 30.72 | 30.72 | 30.72 | 30.72 | 30.72 | 30.72 | 30.72 |
| EBITAT | -215,818.4 | -90,198.8 | 113,815.8 | 112,434.8 | 127,475.4 | -30,174.8 | -35,588.5 | -41,973.5 | -49,504.1 | -58,385.7 |
| Depreciation | ||||||||||
| Changes in Account Receivables | ||||||||||
| Changes in Inventories | ||||||||||
| Changes in Accounts Payable | ||||||||||
| Capital Expenditure | ||||||||||
| UFCF | -465,091.4 | -240,037.8 | -6,867.2 | -12,464.2 | -448.6 | -247,953.0 | -270,189.3 | -318,664.7 | -375,837.1 | -443,266.9 |
| WACC, % | 3.86 | 4.12 | 4.12 | 3.56 | 3.59 | 3.85 | 3.85 | 3.85 | 3.85 | 3.85 |
| PV UFCF | ||||||||||
| SUM PV UFCF | -1,463,896.6 | |||||||||
| Long Term Growth Rate, % | 2.90 | |||||||||
| Free cash flow (T + 1) | -456,122 | |||||||||
| Terminal Value | -47,999,708 | |||||||||
| Present Terminal Value | -39,737,512 | |||||||||
| Enterprise Value | -41,201,408 | |||||||||
| Net Debt | 1,317,677 | |||||||||
| Equity Value | -42,519,085 | |||||||||
| Diluted Shares Outstanding, MM | 475 | |||||||||
| Equity Value Per Share | -89,576.66 |
What You Will Receive
- Accurate 9021T Financials: Access to both historical and projected financial data for precise valuation.
- Customizable Inputs: Adjust parameters such as WACC, tax rates, revenue growth, and capital expenditures.
- Automated Calculations: Dynamic computation of intrinsic value and NPV.
- Scenario Testing: Explore various scenarios to assess the future outlook of West Japan Railway Company.
- User-Friendly Interface: Designed for professionals while remaining easy for newcomers to navigate.
Highlighted Features
- Genuine Financial Data for West Japan Railway Company: Gain access to precise pre-loaded historical figures and future forecasts.
- Customizable Forecast Inputs: Modify the highlighted cells for parameters such as WACC, growth rates, and profit margins.
- Real-Time Calculations: Enjoy automatic updates for DCF, Net Present Value (NPV), and cash flow analysis.
- User-Friendly Dashboard: Easily interpretable charts and summaries to help visualize your valuation outcomes.
- Suitable for All Skill Levels: An intuitive design tailored for investors, CFOs, and consultants alike.
How It Works
- 1. Access the Template: Download and open the Excel file featuring West Japan Railway Company's (9021T) preloaded data.
- 2. Modify Assumptions: Adjust key inputs such as growth rates, WACC, and capital expenditures related to West Japan Railway Company (9021T).
- 3. View Results Instantly: The DCF model automatically calculates intrinsic value and NPV for West Japan Railway Company (9021T).
- 4. Explore Scenarios: Analyze various forecasts to evaluate different valuation scenarios for West Japan Railway Company (9021T).
- 5. Use with Confidence: Present professional valuation insights for West Japan Railway Company (9021T) to inform your strategic decisions.
Why Choose This Calculator for West Japan Railway Company (9021T)?
- User-Friendly Interface: Tailored for both novice and seasoned users.
- Customizable Inputs: Adjust parameters effortlessly for your analysis.
- Real-Time Updates: Monitor immediate changes to West Japan Railway Company’s valuation as you tweak inputs.
- Instant Access: Comes preloaded with West Japan Railway Company’s latest financial figures for swift evaluation.
- Preferred by Experts: Utilized by investors and analysts to guide their decisions.
Who Should Utilize This Product?
- Investors: Obtain precise estimates of West Japan Railway Company's (9021T) fair value prior to making investment choices.
- CFOs: Utilize a high-quality DCF model for financial reporting and comprehensive analysis.
- Consultants: Efficiently customize the template for valuation reports tailored to client needs.
- Entrepreneurs: Discover financial modeling techniques employed by leading corporations.
- Educators: Employ it as a resource for teaching valuation methodologies effectively.
Contents of the Template
- Preloaded JR-West Data: Historical and projected financial information, such as revenue, EBIT, and capital expenditures.
- DCF and WACC Models: High-quality spreadsheets for determining intrinsic value and Weighted Average Cost of Capital.
- Editable Inputs: Yellow-highlighted cells for modifying revenue growth, tax rates, and discount rates.
- Financial Statements: Detailed annual and quarterly financial reports for in-depth analysis.
- Key Ratios: Metrics for profitability, leverage, and efficiency to assess performance.
- Dashboard and Charts: Visual representations of valuation outcomes and underlying assumptions.
Disclaimer
All information, articles, and product details provided on this website are for general informational and educational purposes only. We do not claim any ownership over, nor do we intend to infringe upon, any trademarks, copyrights, logos, brand names, or other intellectual property mentioned or depicted on this site. Such intellectual property remains the property of its respective owners, and any references here are made solely for identification or informational purposes, without implying any affiliation, endorsement, or partnership.
We make no representations or warranties, express or implied, regarding the accuracy, completeness, or suitability of any content or products presented. Nothing on this website should be construed as legal, tax, investment, financial, medical, or other professional advice. In addition, no part of this site—including articles or product references—constitutes a solicitation, recommendation, endorsement, advertisement, or offer to buy or sell any securities, franchises, or other financial instruments, particularly in jurisdictions where such activity would be unlawful.
All content is of a general nature and may not address the specific circumstances of any individual or entity. It is not a substitute for professional advice or services. Any actions you take based on the information provided here are strictly at your own risk. You accept full responsibility for any decisions or outcomes arising from your use of this website and agree to release us from any liability in connection with your use of, or reliance upon, the content or products found herein.