
|
Kamigumi Co., Ltd. (9364.t) DCF -Bewertung |
Fully Editable: Tailor To Your Needs In Excel Or Sheets
Professional Design: Trusted, Industry-Standard Templates
Investor-Approved Valuation Models
MAC/PC Compatible, Fully Unlocked
No Expertise Is Needed; Easy To Follow
Kamigumi Co., Ltd. (9364.T) Bundle
Entdecken Sie das wahre Potenzial von Kamigumi Co., Ltd. (9364t) mit unserem fortschrittlichen DCF -Taschenrechner! Passen Sie die wesentlichen Annahmen an, erkunden Sie verschiedene Szenarien und bewerten Sie, wie Änderungen die Bewertung der Kamigumi Co., Ltd. (9364T) beeinflussen-alles innerhalb einer benutzerfreundlichen Excel-Vorlage.
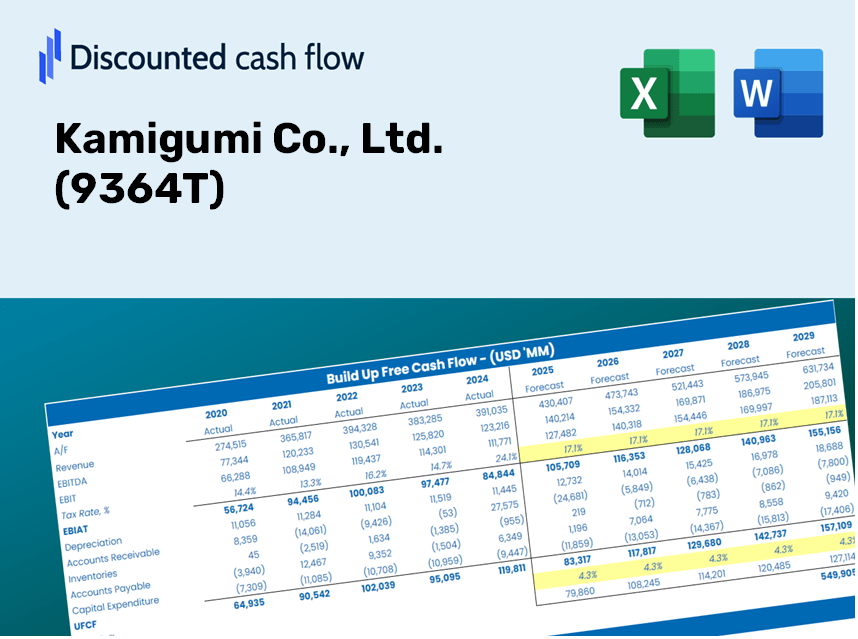
Discounted Cash Flow (DCF) - (USD MM)
| Year | AY1 2021 |
AY2 2022 |
AY3 2023 |
AY4 2024 |
AY5 2025 |
FY1 2026 |
FY2 2027 |
FY3 2028 |
FY4 2029 |
FY5 2030 |
|---|---|---|---|---|---|---|---|---|---|---|
| Revenue | 268,290.0 | 261,681.0 | 274,139.0 | 266,785.0 | 279,182.0 | 282,156.4 | 285,162.5 | 288,200.6 | 291,271.1 | 294,374.4 |
| Revenue Growth, % | 0 | -2.46 | 4.76 | -2.68 | 4.65 | 1.07 | 1.07 | 1.07 | 1.07 | 1.07 |
| EBITDA | 37,365.0 | 43,373.0 | 48,565.0 | 49,049.0 | 51,356.0 | 47,965.3 | 48,476.3 | 48,992.8 | 49,514.8 | 50,042.3 |
| EBITDA, % | 13.93 | 16.57 | 17.72 | 18.39 | 18.4 | 17 | 17 | 17 | 17 | 17 |
| Depreciation | 12,914.0 | 13,082.0 | 13,589.0 | 13,651.0 | 13,191.0 | 13,888.5 | 14,036.5 | 14,186.0 | 14,337.2 | 14,489.9 |
| Depreciation, % | 4.81 | 5 | 4.96 | 5.12 | 4.72 | 4.92 | 4.92 | 4.92 | 4.92 | 4.92 |
| EBIT | 24,451.0 | 30,291.0 | 34,976.0 | 35,398.0 | 38,165.0 | 34,076.8 | 34,439.8 | 34,806.8 | 35,177.6 | 35,552.4 |
| EBIT, % | 9.11 | 11.58 | 12.76 | 13.27 | 13.67 | 12.08 | 12.08 | 12.08 | 12.08 | 12.08 |
| Total Cash | 44,076.0 | 56,397.0 | 76,280.0 | 90,431.0 | 101,886.0 | 76,857.5 | 77,676.4 | 78,503.9 | 79,340.3 | 80,185.6 |
| Total Cash, percent | .0 | .0 | .0 | .0 | .0 | .0 | .0 | .0 | .0 | .0 |
| Account Receivables | 47,463.0 | 47,767.0 | 49,317.0 | 48,880.0 | 49,550.0 | 50,790.8 | 51,332.0 | 51,878.9 | 52,431.6 | 52,990.2 |
| Account Receivables, % | 17.69 | 18.25 | 17.99 | 18.32 | 17.75 | 18 | 18 | 18 | 18 | 18 |
| Inventories | 783.0 | 764.0 | 816.0 | 893.0 | 1,046.0 | 897.7 | 907.3 | 917.0 | 926.7 | 936.6 |
| Inventories, % | 0.29185 | 0.29196 | 0.29766 | 0.33473 | 0.37467 | 0.31817 | 0.31817 | 0.31817 | 0.31817 | 0.31817 |
| Accounts Payable | 26,066.0 | 27,107.0 | 25,831.0 | 24,718.0 | 26,152.0 | 27,160.1 | 27,449.5 | 27,741.9 | 28,037.5 | 28,336.2 |
| Accounts Payable, % | 9.72 | 10.36 | 9.42 | 9.27 | 9.37 | 9.63 | 9.63 | 9.63 | 9.63 | 9.63 |
| Capital Expenditure | -12,155.0 | -16,628.0 | -11,680.0 | -6,579.0 | -13,177.0 | -12,601.9 | -12,736.1 | -12,871.8 | -13,009.0 | -13,147.6 |
| Capital Expenditure, % | -4.53 | -6.35 | -4.26 | -2.47 | -4.72 | -4.47 | -4.47 | -4.47 | -4.47 | -4.47 |
| Tax Rate, % | 29.27 | 29.27 | 29.27 | 29.27 | 29.27 | 29.27 | 29.27 | 29.27 | 29.27 | 29.27 |
| EBITAT | 16,934.0 | 20,861.0 | 24,632.7 | 25,064.0 | 26,992.3 | 23,859.5 | 24,113.7 | 24,370.6 | 24,630.3 | 24,892.7 |
| Depreciation | ||||||||||
| Changes in Account Receivables | ||||||||||
| Changes in Inventories | ||||||||||
| Changes in Accounts Payable | ||||||||||
| Capital Expenditure | ||||||||||
| UFCF | -4,487.0 | 18,071.0 | 23,663.7 | 31,383.0 | 27,617.3 | 25,061.7 | 25,152.7 | 25,420.7 | 25,691.5 | 25,965.3 |
| WACC, % | 5.51 | 5.51 | 5.52 | 5.52 | 5.52 | 5.52 | 5.52 | 5.52 | 5.52 | 5.52 |
| PV UFCF | ||||||||||
| SUM PV UFCF | 108,557.5 | |||||||||
| Long Term Growth Rate, % | 1.00 | |||||||||
| Free cash flow (T + 1) | 26,225 | |||||||||
| Terminal Value | 580,607 | |||||||||
| Present Terminal Value | 443,889 | |||||||||
| Enterprise Value | 552,446 | |||||||||
| Net Debt | -34,610 | |||||||||
| Equity Value | 587,056 | |||||||||
| Diluted Shares Outstanding, MM | 104 | |||||||||
| Equity Value Per Share | 5,620.40 |
What You'll Receive
- Authentic KAMIGUMI Financials: Access to both historical and projected data for precise valuation.
- Customizable Inputs: Adjust parameters such as WACC, tax rates, revenue growth, and capital expenditures.
- Dynamic Calculations: Intrinsic value and NPV are computed automatically.
- Scenario Analysis: Evaluate various scenarios to assess the future performance of Kamigumi Co., Ltd. (9364T).
- User-Friendly Design: Designed for professionals while remaining approachable for newcomers.
Key Features
- Pre-Loaded Data: Kamigumi Co., Ltd.'s historical financial records and pre-filled forecasts.
- Fully Adjustable Inputs: Customize WACC, tax rates, revenue growth, and EBITDA margins as needed.
- Instant Results: Watch as Kamigumi Co., Ltd.'s intrinsic value recalculates in real-time.
- Clear Visual Outputs: Dashboard charts showcase valuation results and essential metrics.
- Built for Accuracy: A professional-grade tool designed for analysts, investors, and finance professionals.
How It Operates
- Download: Obtain the comprehensive Excel file featuring Kamigumi Co., Ltd.'s (9364T) financial data.
- Customize: Tailor your forecasts, including revenue growth, EBITDA %, and WACC.
- Update Automatically: Watch as the intrinsic value and NPV calculations refresh in real-time.
- Test Scenarios: Develop multiple projections and instantly compare results.
- Make Decisions: Utilize the valuation outcomes to inform your investment approach.
Why Opt for This Calculator?
- Precise Information: Authentic Kamigumi Co., Ltd. (9364T) financials guarantee trustworthy valuation outcomes.
- Fully Customizable: Modify essential factors such as growth rates, WACC, and tax rates to align with your forecasts.
- Time Efficient: Pre-configured calculations save you the hassle of starting from the ground up.
- Professional-Quality Tool: Tailored for investors, analysts, and consultants alike.
- User-Friendly Interface: Clear layout and guided instructions make it accessible for users of all experience levels.
Who Should Use Kamigumi Co., Ltd. (9364T)?
- Investors: Accurately assess the fair value of Kamigumi Co., Ltd. (9364T) prior to making investment choices.
- CFOs: Utilize a professional-grade DCF model for comprehensive financial reporting and analysis.
- Consultants: Seamlessly customize the template for client valuation reports related to Kamigumi Co., Ltd. (9364T).
- Entrepreneurs: Discover financial modeling techniques employed by leading companies in the industry.
- Educators: Apply it as a resource to teach valuation methodologies effectively.
Components of the Template
- Preloaded KAMIGUMI Data: Historical and forecasted financial metrics, including revenue, EBIT, and capital expenses.
- DCF and WACC Models: Advanced templates for calculating intrinsic value and Weighted Average Cost of Capital.
- Customizable Inputs: Yellow-highlighted fields for modifying revenue growth, tax rates, and discount rates.
- Financial Statements: Detailed annual and quarterly financial reports for extensive analysis.
- Key Ratios: Metrics for profitability, leverage, and efficiency to assess performance.
- Dashboard and Charts: Visual representations of valuation results and underlying assumptions.
Disclaimer
All information, articles, and product details provided on this website are for general informational and educational purposes only. We do not claim any ownership over, nor do we intend to infringe upon, any trademarks, copyrights, logos, brand names, or other intellectual property mentioned or depicted on this site. Such intellectual property remains the property of its respective owners, and any references here are made solely for identification or informational purposes, without implying any affiliation, endorsement, or partnership.
We make no representations or warranties, express or implied, regarding the accuracy, completeness, or suitability of any content or products presented. Nothing on this website should be construed as legal, tax, investment, financial, medical, or other professional advice. In addition, no part of this site—including articles or product references—constitutes a solicitation, recommendation, endorsement, advertisement, or offer to buy or sell any securities, franchises, or other financial instruments, particularly in jurisdictions where such activity would be unlawful.
All content is of a general nature and may not address the specific circumstances of any individual or entity. It is not a substitute for professional advice or services. Any actions you take based on the information provided here are strictly at your own risk. You accept full responsibility for any decisions or outcomes arising from your use of this website and agree to release us from any liability in connection with your use of, or reliance upon, the content or products found herein.