
|
TV Asahi Holdings Corporation (9409.t) DCF -Bewertung |
Fully Editable: Tailor To Your Needs In Excel Or Sheets
Professional Design: Trusted, Industry-Standard Templates
Investor-Approved Valuation Models
MAC/PC Compatible, Fully Unlocked
No Expertise Is Needed; Easy To Follow
TV Asahi Holdings Corporation (9409.T) Bundle
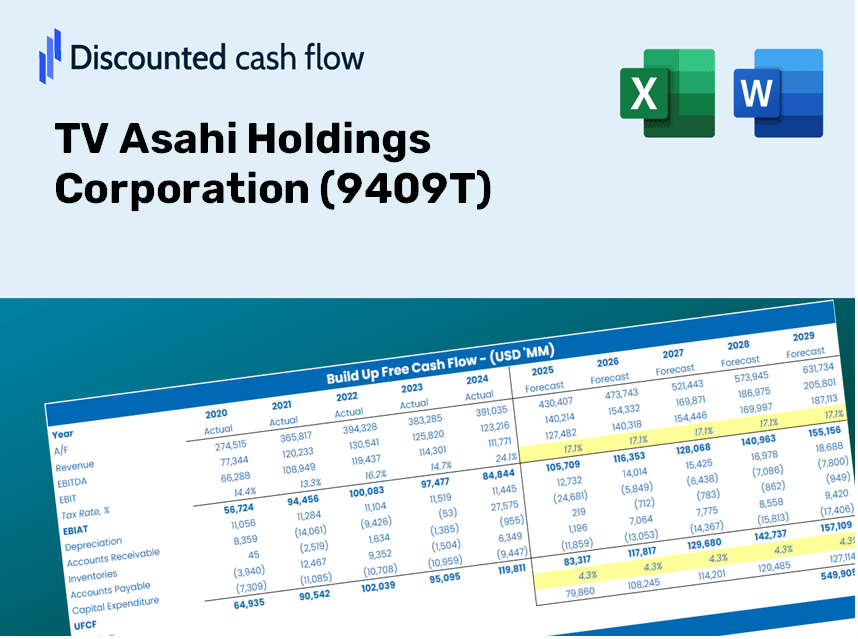
Möchten Sie den inneren Wert der TV Asahi Holdings Corporation bewerten? Unser (9409T) DCF-Taschenrechner integriert reale Daten mit umfangreichen Anpassungsfunktionen, sodass Sie Ihre Prognosen verfeinern und Ihre Investitionsauswahl verbessern können.
Benefits You Will Receive
- Adjustable Forecast Inputs: Seamlessly modify assumptions (growth %, margins, WACC) to explore various scenarios.
- Current Financial Data: TV Asahi Holdings Corporation’s (9409T) financials are pre-loaded to accelerate your analysis.
- Automated DCF Calculations: The template computes Net Present Value (NPV) and intrinsic value automatically.
- Professional and Customizable: A refined Excel model that can be tailored to suit your valuation requirements.
- Designed for Analysts and Investors: Perfect for testing forecasts, validating strategies, and enhancing efficiency.
Core Features
- Pre-Loaded Financial Data: TV Asahi Holdings Corporation's historical financial statements and pre-filled forecasts.
- Customizable Inputs: Adjust WACC, tax rates, revenue growth, and EBITDA margins according to your analysis needs.
- Real-Time Results: Monitor the intrinsic value of TV Asahi Holdings Corporation (9409T) as it recalculates instantly.
- Visual Output Clarity: Dashboard graphs present valuation results and essential metrics in an accessible format.
- Designed for Precision: A professional-grade tool tailored for analysts, investors, and finance professionals.
How It Works
- Download: Access the ready-to-use Excel file containing TV Asahi Holdings Corporation's (9409T) financial data.
- Customize: Modify forecasts such as revenue growth, EBITDA %, and WACC to suit your analysis.
- Update Automatically: Intrinsic value and NPV calculations refresh in real-time as you make changes.
- Test Scenarios: Generate various projections and compare results instantly.
- Make Decisions: Leverage the valuation insights to inform your investment strategies.
Why Choose This Calculator for TV Asahi Holdings Corporation (9409T)?
- User-Friendly Design: Tailored for both novice users and seasoned professionals.
- Customizable Inputs: Easily adjust parameters to suit your analysis requirements.
- Real-Time Valuation: Instantly visualize changes in TV Asahi's valuation as you modify inputs.
- Preloaded Financial Data: Comes with comprehensive financial information for TV Asahi for efficient analysis.
- Widely Trusted: Favored by analysts and investors to guide their financial decisions.
Who is This Product Designed For?
- Professional Investors: Create comprehensive and dependable valuation models for analyzing portfolios related to TV Asahi Holdings Corporation (9409T).
- Corporate Finance Teams: Evaluate various valuation scenarios to inform strategic decisions within the organization.
- Consultants and Advisors: Deliver precise valuation insights to clients focusing on TV Asahi Holdings Corporation (9409T).
- Students and Educators: Utilize real-world data to enhance learning and practice in financial modeling.
- Media and Tech Enthusiasts: Gain insights into how media companies like TV Asahi Holdings Corporation (9409T) are valued in the competitive market.
Contents of the Template
- Comprehensive DCF Model: An editable template featuring in-depth valuation calculations.
- Real-World Data: TV Asahi Holdings Corporation’s (9409T) historical and projected financials pre-loaded for detailed analysis.
- Customizable Parameters: Modify WACC, growth rates, and tax assumptions to explore various scenarios.
- Financial Statements: Complete annual and quarterly breakdowns for enhanced insights.
- Key Ratios: Integrated analysis covering profitability, efficiency, and leverage metrics.
- Dashboard with Visual Outputs: Includes charts and tables for clear, actionable insights.
Disclaimer
All information, articles, and product details provided on this website are for general informational and educational purposes only. We do not claim any ownership over, nor do we intend to infringe upon, any trademarks, copyrights, logos, brand names, or other intellectual property mentioned or depicted on this site. Such intellectual property remains the property of its respective owners, and any references here are made solely for identification or informational purposes, without implying any affiliation, endorsement, or partnership.
We make no representations or warranties, express or implied, regarding the accuracy, completeness, or suitability of any content or products presented. Nothing on this website should be construed as legal, tax, investment, financial, medical, or other professional advice. In addition, no part of this site—including articles or product references—constitutes a solicitation, recommendation, endorsement, advertisement, or offer to buy or sell any securities, franchises, or other financial instruments, particularly in jurisdictions where such activity would be unlawful.
All content is of a general nature and may not address the specific circumstances of any individual or entity. It is not a substitute for professional advice or services. Any actions you take based on the information provided here are strictly at your own risk. You accept full responsibility for any decisions or outcomes arising from your use of this website and agree to release us from any liability in connection with your use of, or reliance upon, the content or products found herein.