
|
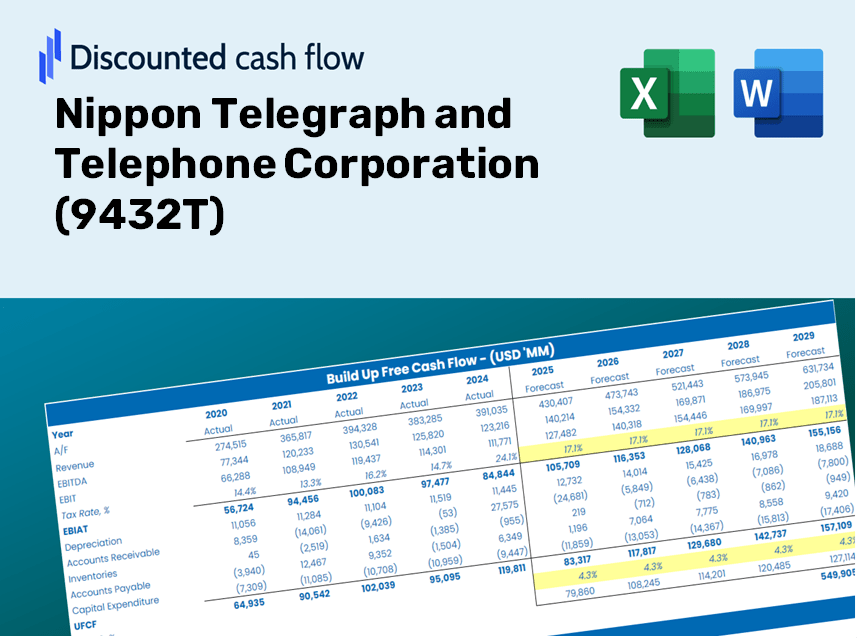
Nippon Telegraph and Telephone Corporation (9432.t) DCF -Bewertung |
Fully Editable: Tailor To Your Needs In Excel Or Sheets
Professional Design: Trusted, Industry-Standard Templates
Investor-Approved Valuation Models
MAC/PC Compatible, Fully Unlocked
No Expertise Is Needed; Easy To Follow
Nippon Telegraph and Telephone Corporation (9432.T) Bundle
Erwerben Sie ein umfassendes Verständnis Ihrer Nippon Telegraph and Telephone Corporation (9432T) Bewertungsanalyse mit unserem hochmodernen DCF-Taschenrechner! Diese Excel -Vorlage wird mit realen (9432T) -Daten vorinstalliert, sodass Sie Prognosen und Annahmen anpassen können, um den inneren Wert von Nippon Telegraph und Telephone Corporation genau zu bestimmen.
Discounted Cash Flow (DCF) - (USD MM)
| Year | AY1 2021 |
AY2 2022 |
AY3 2023 |
AY4 2024 |
AY5 2025 |
FY1 2026 |
FY2 2027 |
FY3 2028 |
FY4 2029 |
FY5 2030 |
|---|---|---|---|---|---|---|---|---|---|---|
| Revenue | 11,943,966.0 | 12,156,447.0 | 13,136,194.0 | 13,374,569.0 | 13,704,727.0 | 14,188,560.7 | 14,689,475.8 | 15,208,075.3 | 15,744,983.5 | 16,300,846.7 |
| Revenue Growth, % | 0 | 1.78 | 8.06 | 1.81 | 2.47 | 3.53 | 3.53 | 3.53 | 3.53 | 3.53 |
| EBITDA | 3,203,469.0 | 3,392,380.0 | 3,462,215.0 | 3,699,301.0 | 3,418,009.0 | 3,793,530.6 | 3,927,458.0 | 4,066,113.6 | 4,209,664.3 | 4,358,282.9 |
| EBITDA, % | 26.82 | 27.91 | 26.36 | 27.66 | 24.94 | 26.74 | 26.74 | 26.74 | 26.74 | 26.74 |
| Depreciation | 1,507,153.0 | 1,561,183.0 | 1,582,625.0 | 1,628,586.0 | 1,722,035.0 | 1,766,497.9 | 1,828,862.6 | 1,893,429.0 | 1,960,274.9 | 2,029,480.8 |
| Depreciation, % | 12.62 | 12.84 | 12.05 | 12.18 | 12.57 | 12.45 | 12.45 | 12.45 | 12.45 | 12.45 |
| EBIT | 1,696,316.0 | 1,831,197.0 | 1,879,590.0 | 2,070,715.0 | 1,695,974.0 | 2,027,032.7 | 2,098,595.4 | 2,172,684.5 | 2,249,389.3 | 2,328,802.1 |
| EBIT, % | 14.2 | 15.06 | 14.31 | 15.48 | 12.38 | 14.29 | 14.29 | 14.29 | 14.29 | 14.29 |
| Total Cash | 965,087.0 | 888,650.0 | 859,649.0 | 1,054,100.0 | 1,605,373.0 | 1,178,494.6 | 1,220,100.4 | 1,263,175.0 | 1,307,770.3 | 1,353,940.0 |
| Total Cash, percent | .0 | .0 | .0 | .0 | .0 | .0 | .0 | .0 | .0 | .0 |
| Account Receivables | 2,623,236.0 | 3,741,490.0 | 4,353,692.0 | 5,014,296.0 | 5,145,802.0 | 4,566,512.1 | 4,727,728.9 | 4,894,637.4 | 5,067,438.4 | 5,246,340.0 |
| Account Receivables, % | 21.96 | 30.78 | 33.14 | 37.49 | 37.55 | 32.18 | 32.18 | 32.18 | 32.18 | 32.18 |
| Inventories | 315,437.0 | 408,362.0 | 517,409.0 | 524,166.0 | 556,576.0 | 508,498.8 | 526,450.9 | 545,036.8 | 564,278.8 | 584,200.2 |
| Inventories, % | 2.64 | 3.36 | 3.94 | 3.92 | 4.06 | 3.58 | 3.58 | 3.58 | 3.58 | 3.58 |
| Accounts Payable | 2,356,705.0 | 2,500,341.0 | 1,110,536.0 | 2,940,928.0 | 1,152,612.0 | 2,246,124.8 | 2,325,422.3 | 2,407,519.4 | 2,492,514.8 | 2,580,510.9 |
| Accounts Payable, % | 19.73 | 20.57 | 8.45 | 21.99 | 8.41 | 15.83 | 15.83 | 15.83 | 15.83 | 15.83 |
| Capital Expenditure | -1,795,164.0 | -1,758,045.0 | -1,851,879.0 | -2,084,004.0 | -2,132,292.0 | -2,120,619.2 | -2,195,485.9 | -2,272,995.7 | -2,353,241.8 | -2,436,321.1 |
| Capital Expenditure, % | -15.03 | -14.46 | -14.1 | -15.58 | -15.56 | -14.95 | -14.95 | -14.95 | -14.95 | -14.95 |
| Tax Rate, % | 36.09 | 36.09 | 36.09 | 36.09 | 36.09 | 36.09 | 36.09 | 36.09 | 36.09 | 36.09 |
| EBITAT | 940,430.8 | 1,204,547.8 | 1,254,435.3 | 1,337,834.3 | 1,083,917.3 | 1,283,019.5 | 1,328,315.4 | 1,375,210.5 | 1,423,761.1 | 1,474,025.8 |
| Depreciation | ||||||||||
| Changes in Account Receivables | ||||||||||
| Changes in Inventories | ||||||||||
| Changes in Accounts Payable | ||||||||||
| Capital Expenditure | ||||||||||
| UFCF | 70,451.8 | -59,857.2 | -1,125,872.7 | 2,045,447.3 | -1,278,571.7 | 2,649,778.1 | 861,820.7 | 892,246.6 | 923,746.6 | 956,358.7 |
| WACC, % | 3.46 | 3.64 | 3.65 | 3.62 | 3.6 | 3.59 | 3.59 | 3.59 | 3.59 | 3.59 |
| PV UFCF | ||||||||||
| SUM PV UFCF | 5,767,245.1 | |||||||||
| Long Term Growth Rate, % | 1.00 | |||||||||
| Free cash flow (T + 1) | 965,922 | |||||||||
| Terminal Value | 37,249,124 | |||||||||
| Present Terminal Value | 31,222,025 | |||||||||
| Enterprise Value | 36,989,270 | |||||||||
| Net Debt | 9,760,504 | |||||||||
| Equity Value | 27,228,766 | |||||||||
| Diluted Shares Outstanding, MM | 83,611 | |||||||||
| Equity Value Per Share | 325.66 |
Benefits You Will Receive
- Comprehensive Financial Model: Leverage NTT’s actual data for accurate DCF valuation.
- Complete Forecast Control: Modify revenue growth, profit margins, WACC, and other essential metrics.
- Real-Time Calculations: Automatic updates provide immediate feedback as you adjust parameters.
- Professional-Grade Template: A polished Excel file crafted for high-quality valuation presentations.
- Flexible and Reusable: Designed for adaptability, making it suitable for in-depth forecasting over time.
Key Features
- Accurate NTT Financials: Gain access to reliable pre-loaded historical data and projections for the future.
- Adjustable Forecast Parameters: Modify highlighted cells for WACC, growth rates, and margins to suit your analysis.
- Automated Calculations: Enjoy real-time updates for DCF, Net Present Value (NPV), and cash flow evaluations.
- User-Friendly Dashboard: Intuitive charts and summaries to help you easily interpret your valuation outcomes.
- Designed for Everyone: A straightforward, accessible layout tailored for investors, CFOs, and consultants alike.
How It Works
- Step 1: Download the Excel file.
- Step 2: Examine Nippon Telegraph and Telephone Corporation's pre-filled financial data and forecasts.
- Step 3: Adjust key inputs such as revenue growth, WACC, and tax rates (highlighted cells).
- Step 4: Observe the DCF model update in real-time as you modify your assumptions.
- Step 5: Evaluate the outputs and leverage the results for your investment strategies.
Why Choose the NTT Calculator?
- Time Efficient: Skip the hassle of building a DCF model from the ground up – it's ready for immediate use.
- Enhanced Accuracy: Dependable financial data and established formulas minimize valuation errors.
- Completely Customizable: Adjust the model to align with your specific assumptions and forecasts.
- User-Friendly: Intuitive charts and outputs simplify result interpretation.
- Preferred by Professionals: Crafted for industry experts who prioritize accuracy and functionality.
Who Should Utilize This Product?
- Investors: Assess the valuation of Nippon Telegraph and Telephone Corporation (9432T) prior to buying or selling shares.
- CFOs and Financial Analysts: Enhance efficiency in valuation processes and evaluate financial projections.
- Startup Founders: Discover how major corporations like Nippon Telegraph and Telephone are valued in the market.
- Consultants: Provide clients with comprehensive and professional valuation reports.
- Students and Educators: Utilize real market data to practice and instruct on valuation methodologies.
Contents of the Template
- Operating and Balance Sheet Data: Historical data and forecasts for Nippon Telegraph and Telephone Corporation (9432T), including revenue, EBITDA, EBIT, and capital expenditures.
- WACC Calculation: A dedicated sheet for the Weighted Average Cost of Capital (WACC), featuring parameters such as Beta, risk-free rate, and share price.
- DCF Valuation (Unlevered and Levered): Customizable Discounted Cash Flow models that display intrinsic value with comprehensive calculations.
- Financial Statements: Pre-loaded annual and quarterly financial statements to facilitate analysis.
- Key Ratios: Provides profitability, leverage, and efficiency ratios for Nippon Telegraph and Telephone Corporation (9432T).
- Dashboard and Charts: A visual overview of valuation outputs and assumptions for effortless result analysis.
Disclaimer
All information, articles, and product details provided on this website are for general informational and educational purposes only. We do not claim any ownership over, nor do we intend to infringe upon, any trademarks, copyrights, logos, brand names, or other intellectual property mentioned or depicted on this site. Such intellectual property remains the property of its respective owners, and any references here are made solely for identification or informational purposes, without implying any affiliation, endorsement, or partnership.
We make no representations or warranties, express or implied, regarding the accuracy, completeness, or suitability of any content or products presented. Nothing on this website should be construed as legal, tax, investment, financial, medical, or other professional advice. In addition, no part of this site—including articles or product references—constitutes a solicitation, recommendation, endorsement, advertisement, or offer to buy or sell any securities, franchises, or other financial instruments, particularly in jurisdictions where such activity would be unlawful.
All content is of a general nature and may not address the specific circumstances of any individual or entity. It is not a substitute for professional advice or services. Any actions you take based on the information provided here are strictly at your own risk. You accept full responsibility for any decisions or outcomes arising from your use of this website and agree to release us from any liability in connection with your use of, or reliance upon, the content or products found herein.