
|
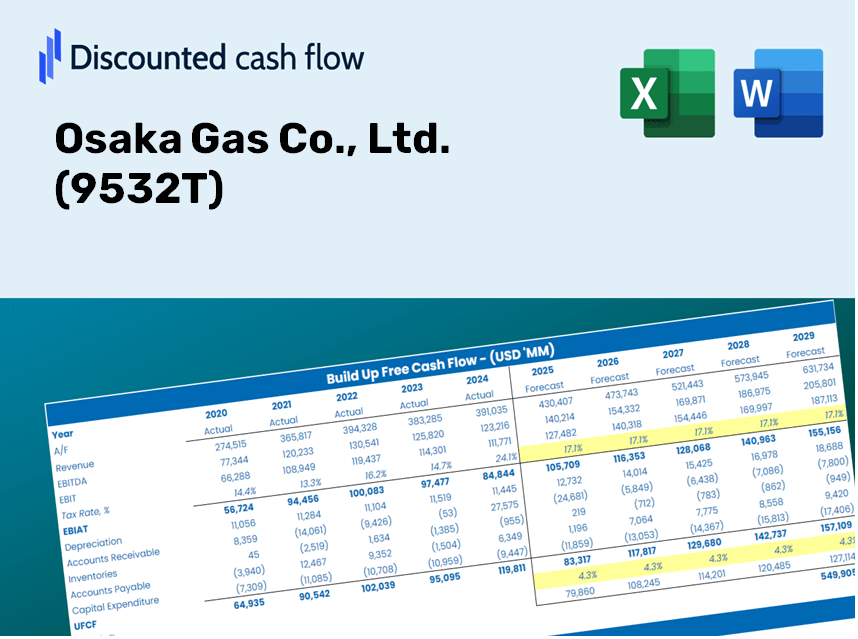
Osaka Gas Co., Ltd. (9532.t) DCF -Bewertung |
Fully Editable: Tailor To Your Needs In Excel Or Sheets
Professional Design: Trusted, Industry-Standard Templates
Investor-Approved Valuation Models
MAC/PC Compatible, Fully Unlocked
No Expertise Is Needed; Easy To Follow
Osaka Gas Co., Ltd. (9532.T) Bundle
Möchten Sie den inneren Wert von Osaka Gas Co., Ltd. ermitteln? Unser (9532T) DCF-Taschenrechner integriert reale Daten mit umfangreichen Anpassungsfunktionen, sodass Sie Ihre Prognosen verfeinern und Ihre Investitionsauswahl verbessern können.
What You Will Receive
- Pre-Filled Financial Model: Utilize Osaka Gas Co., Ltd.’s actual data for accurate DCF valuation.
- Comprehensive Forecast Control: Modify revenue growth, profit margins, WACC, and other essential factors.
- Real-Time Calculations: Automatic updates allow you to view outcomes instantly as you make adjustments.
- Professional-Grade Template: A polished Excel file crafted for high-quality valuation presentations.
- Flexible and Reusable: Customizable for versatility, enabling repeated use for in-depth forecasting.
Key Features
- Real-Time 9532T Data: Pre-loaded with Osaka Gas's historical financial information and future projections.
- Adaptable Input Options: Modify revenue growth rates, profit margins, WACC, tax percentages, and capital expenditure estimates.
- Interactive Valuation Model: Instant updates to Net Present Value (NPV) and intrinsic value based on your adjustments.
- Scenario Analysis: Develop various forecasting scenarios to evaluate different valuation results.
- User-Centric Layout: Intuitive and organized, suitable for both experts and newcomers.
How It Functions
- Step 1: Download the ready-to-use Excel template featuring Osaka Gas Co., Ltd. (9532T) data.
- Step 2: Review the pre-populated sheets to familiarize yourself with the essential metrics.
- Step 3: Modify the forecasts and assumptions in the editable yellow cells (WACC, growth, margins).
- Step 4: Immediately observe the updated results, including the intrinsic value of Osaka Gas Co., Ltd. (9532T).
- Step 5: Utilize the outputs to make informed investment choices or create detailed reports.
Why Choose This Calculator for Osaka Gas Co., Ltd. (9532T)?
- Designed for Experts: A sophisticated tool favored by analysts, CFOs, and industry consultants.
- Accurate Data: Historical and forecasted financial information for Osaka Gas preloaded for precision.
- Flexible Scenario Analysis: Effortlessly test various predictions and assumptions.
- Clear Results: Automatically computes intrinsic value, NPV, and other essential metrics.
- User-Friendly: Comprehensive step-by-step guidance to navigate through the process.
Who Should Utilize This Service?
- Individual Investors: Gain clarity in making decisions regarding the purchase or sale of Osaka Gas Co., Ltd. (9532T) stock.
- Financial Analysts: Enhance your valuation processes with comprehensive financial models tailored for Osaka Gas Co., Ltd. (9532T).
- Consultants: Provide accurate and timely valuation insights for your clients in relation to Osaka Gas Co., Ltd. (9532T).
- Business Owners: Learn how major companies like Osaka Gas Co., Ltd. (9532T) are valued to inform your own business strategy.
- Finance Students: Explore valuation methods with real-world examples and data centered around Osaka Gas Co., Ltd. (9532T).
Contents of the Template
- Operating and Balance Sheet Data: Pre-filled historical data and forecasts for Osaka Gas Co., Ltd. (9532T), covering revenue, EBITDA, EBIT, and capital expenditures.
- WACC Calculation: A dedicated sheet for calculating the Weighted Average Cost of Capital (WACC), incorporating parameters such as Beta, risk-free rate, and share price.
- DCF Valuation (Unlevered and Levered): Customizable Discounted Cash Flow models that illustrate intrinsic value with comprehensive calculations.
- Financial Statements: Pre-loaded annual and quarterly financial statements to aid in the analysis process.
- Key Ratios: Features profitability, leverage, and efficiency ratios specific to Osaka Gas Co., Ltd. (9532T).
- Dashboard and Charts: A visual summary of valuation outputs and assumptions designed for straightforward analysis of results.
Disclaimer
All information, articles, and product details provided on this website are for general informational and educational purposes only. We do not claim any ownership over, nor do we intend to infringe upon, any trademarks, copyrights, logos, brand names, or other intellectual property mentioned or depicted on this site. Such intellectual property remains the property of its respective owners, and any references here are made solely for identification or informational purposes, without implying any affiliation, endorsement, or partnership.
We make no representations or warranties, express or implied, regarding the accuracy, completeness, or suitability of any content or products presented. Nothing on this website should be construed as legal, tax, investment, financial, medical, or other professional advice. In addition, no part of this site—including articles or product references—constitutes a solicitation, recommendation, endorsement, advertisement, or offer to buy or sell any securities, franchises, or other financial instruments, particularly in jurisdictions where such activity would be unlawful.
All content is of a general nature and may not address the specific circumstances of any individual or entity. It is not a substitute for professional advice or services. Any actions you take based on the information provided here are strictly at your own risk. You accept full responsibility for any decisions or outcomes arising from your use of this website and agree to release us from any liability in connection with your use of, or reliance upon, the content or products found herein.