
|
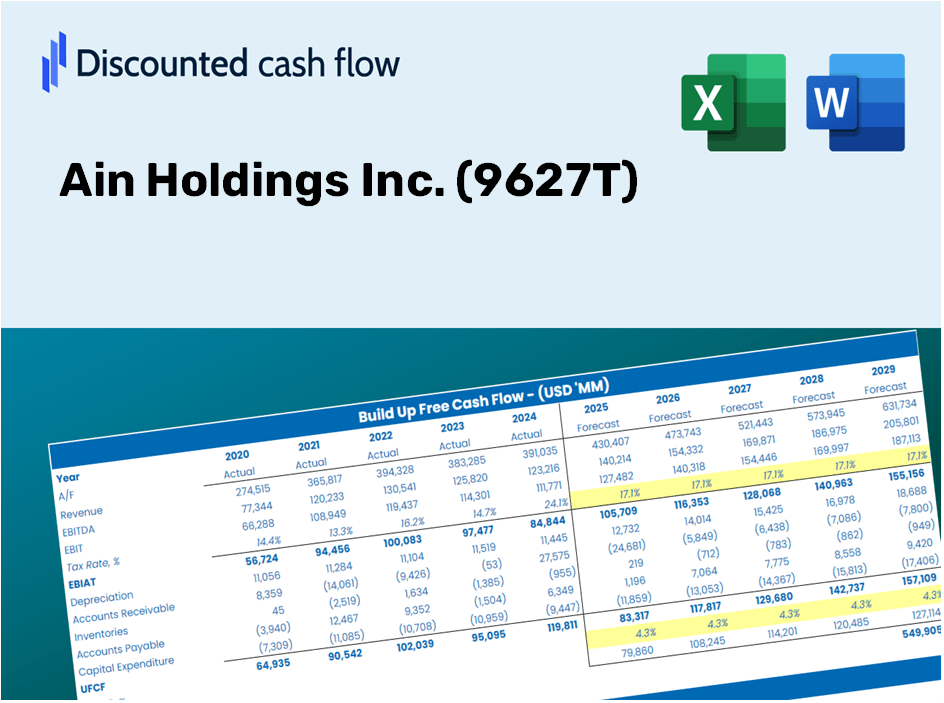
Ain Holdings Inc. (9627.t) DCF -Bewertung |
Fully Editable: Tailor To Your Needs In Excel Or Sheets
Professional Design: Trusted, Industry-Standard Templates
Investor-Approved Valuation Models
MAC/PC Compatible, Fully Unlocked
No Expertise Is Needed; Easy To Follow
Ain Holdings Inc. (9627.T) Bundle
Entdecken Sie den tatsächlichen Wert von Ain Holdings Inc. (9627T) mit unserem DCF-Taschenrechner von Professional Grade! Einfach die wichtigsten Annahmen anpassen, verschiedene Szenarien erkunden und bewerten, wie unterschiedliche Änderungen die Bewertung von Ain Holdings Inc. (9627T) beeinflussen - alles innerhalb einer einzelnen Excel -Vorlage.
Discounted Cash Flow (DCF) - (USD MM)
| Year | AY1 2020 |
AY2 2021 |
AY3 2022 |
AY4 2023 |
AY5 2024 |
FY1 2025 |
FY2 2026 |
FY3 2027 |
FY4 2028 |
FY5 2029 |
|---|---|---|---|---|---|---|---|---|---|---|
| Revenue | 297,305.0 | 316,247.0 | 358,742.0 | 399,824.0 | 456,804.0 | 508,778.6 | 566,666.7 | 631,141.3 | 702,951.7 | 782,932.6 |
| Revenue Growth, % | 0 | 6.37 | 13.44 | 11.45 | 14.25 | 11.38 | 11.38 | 11.38 | 11.38 | 11.38 |
| EBITDA | 19,430.0 | 22,088.0 | 25,796.0 | 30,001.0 | 31,137.0 | 35,645.3 | 39,701.0 | 44,218.1 | 49,249.2 | 54,852.7 |
| EBITDA, % | 6.54 | 6.98 | 7.19 | 7.5 | 6.82 | 7.01 | 7.01 | 7.01 | 7.01 | 7.01 |
| Depreciation | 8,679.0 | 8,925.0 | 9,839.0 | 10,885.0 | 14,168.0 | 14,559.2 | 16,215.8 | 18,060.8 | 20,115.7 | 22,404.4 |
| Depreciation, % | 2.92 | 2.82 | 2.74 | 2.72 | 3.1 | 2.86 | 2.86 | 2.86 | 2.86 | 2.86 |
| EBIT | 10,751.0 | 13,163.0 | 15,957.0 | 19,116.0 | 16,969.0 | 21,086.1 | 23,485.2 | 26,157.4 | 29,133.5 | 32,448.3 |
| EBIT, % | 3.62 | 4.16 | 4.45 | 4.78 | 3.71 | 4.14 | 4.14 | 4.14 | 4.14 | 4.14 |
| Total Cash | 55,271.0 | 59,729.0 | 46,796.0 | 48,611.0 | 26,881.0 | 69,768.4 | 77,706.6 | 86,548.0 | 96,395.3 | 107,363.0 |
| Total Cash, percent | .0 | .0 | .0 | .0 | .0 | .0 | .0 | .0 | .0 | .0 |
| Account Receivables | 22,903.0 | 22,248.0 | 25,573.0 | 31,996.0 | 43,254.0 | 40,029.1 | 44,583.5 | 49,656.2 | 55,306.0 | 61,598.7 |
| Account Receivables, % | 7.7 | 7.04 | 7.13 | 8 | 9.47 | 7.87 | 7.87 | 7.87 | 7.87 | 7.87 |
| Inventories | 14,284.0 | 14,790.0 | 21,585.0 | 24,644.0 | 36,071.0 | 30,077.1 | 33,499.3 | 37,310.8 | 41,555.9 | 46,284.1 |
| Inventories, % | 4.8 | 4.68 | 6.02 | 6.16 | 7.9 | 5.91 | 5.91 | 5.91 | 5.91 | 5.91 |
| Accounts Payable | 46,758.0 | 50,756.0 | 58,698.0 | 65,506.0 | 80,895.0 | 83,675.3 | 93,195.8 | 103,799.5 | 115,609.6 | 128,763.5 |
| Accounts Payable, % | 15.73 | 16.05 | 16.36 | 16.38 | 17.71 | 16.45 | 16.45 | 16.45 | 16.45 | 16.45 |
| Capital Expenditure | -3,930.0 | -5,880.0 | -9,549.0 | -9,130.0 | -7,968.0 | -10,044.1 | -11,186.9 | -12,459.7 | -13,877.4 | -15,456.3 |
| Capital Expenditure, % | -1.32 | -1.86 | -2.66 | -2.28 | -1.74 | -1.97 | -1.97 | -1.97 | -1.97 | -1.97 |
| Tax Rate, % | 44.56 | 44.56 | 44.56 | 44.56 | 44.56 | 44.56 | 44.56 | 44.56 | 44.56 | 44.56 |
| EBITAT | 6,118.8 | 7,112.5 | 9,277.6 | 11,422.5 | 9,407.4 | 11,988.8 | 13,352.8 | 14,872.1 | 16,564.2 | 18,448.9 |
| Depreciation | ||||||||||
| Changes in Account Receivables | ||||||||||
| Changes in Inventories | ||||||||||
| Changes in Accounts Payable | ||||||||||
| Capital Expenditure | ||||||||||
| UFCF | 20,438.8 | 14,304.5 | 7,389.6 | 10,503.5 | 8,311.4 | 28,503.0 | 19,925.6 | 22,192.7 | 24,717.7 | 27,530.1 |
| WACC, % | 4.18 | 4.16 | 4.18 | 4.19 | 4.17 | 4.18 | 4.18 | 4.18 | 4.18 | 4.18 |
| PV UFCF | ||||||||||
| SUM PV UFCF | 108,776.4 | |||||||||
| Long Term Growth Rate, % | 0.50 | |||||||||
| Free cash flow (T + 1) | 27,668 | |||||||||
| Terminal Value | 752,850 | |||||||||
| Present Terminal Value | 613,605 | |||||||||
| Enterprise Value | 722,382 | |||||||||
| Net Debt | 11,844 | |||||||||
| Equity Value | 710,538 | |||||||||
| Diluted Shares Outstanding, MM | 35 | |||||||||
| Equity Value Per Share | 20,279.60 |
What You Will Receive
- Customizable Excel Template: A versatile Excel-based DCF Calculator featuring pre-filled financial data for Ain Holdings Inc. (9627T).
- Actual Data Insights: Access to historical figures and forward-looking projections (indicated in the highlighted cells).
- Flexible Forecast Options: Adjust key assumptions such as revenue growth, EBITDA percentage, and WACC.
- Immediate Calculations: Quickly observe how your inputs influence Ain Holdings Inc.'s (9627T) valuation.
- Professional Resource: Designed for investors, CFOs, consultants, and financial analysts.
- Intuitive Layout: Organized for simplicity and efficiency, complete with step-by-step guidance.
Key Features
- Current Ain Holdings Data: Pre-populated with Ain Holdings Inc.'s historical financials and forward-looking estimates.
- Completely Customizable Inputs: Modify revenue growth rates, profit margins, WACC, tax rates, and capital expenditures.
- Adaptive Valuation Model: Automatic recalculations of Net Present Value (NPV) and intrinsic value based on user inputs.
- Scenario Analysis: Develop various forecast scenarios to evaluate different valuation possibilities.
- Intuitive Design: Clean, organized layout catered to both professionals and newcomers.
How It Operates
- Step 1: Download the prebuilt Excel template featuring Ain Holdings Inc.'s (9627T) data.
- Step 2: Review the filled sheets to familiarize yourself with the key metrics.
- Step 3: Modify forecasts and assumptions in the editable yellow cells (WACC, growth, margins).
- Step 4: Quickly see the updated results, including the intrinsic value of Ain Holdings Inc. (9627T).
- Step 5: Use the results to make informed investment choices or create reports.
Why Choose Ain Holdings Inc. (9627T) Calculator?
- Precision: Uses authentic Ain Holdings financial data for precise calculations.
- Versatility: Tailored for users to easily adjust and experiment with inputs.
- Efficiency: Eliminate the complexities of constructing a DCF model from the ground up.
- High-Quality: Crafted with the accuracy and usability expected by financial executives.
- Intuitive: Simple interface that’s accessible for users without extensive financial modeling skills.
Who Can Benefit from Ain Holdings Inc. (9627T)?
- Investors: Evaluate Ain Holdings' performance and make informed decisions on buying or selling shares.
- CFOs and Financial Analysts: Optimize valuation methods and assess financial forecasts.
- Startup Founders: Understand the valuation strategies applied to established firms like Ain Holdings.
- Consultants: Provide clients with detailed and professional valuation assessments.
- Students and Educators: Access real-time data to enhance learning and practice valuation methodologies.
Contents of the Template
- Preloaded Ain Holdings Data: Historical and projected financial metrics, encompassing revenue, EBIT, and capital expenditures.
- DCF and WACC Models: High-quality spreadsheets designed for calculating intrinsic value and Weighted Average Cost of Capital.
- Editable Inputs: Cells highlighted in yellow for modifying revenue growth rates, tax rates, and discount rates.
- Financial Statements: Detailed annual and quarterly financial reports for in-depth analysis.
- Key Ratios: Metrics related to profitability, leverage, and efficiency for performance assessment.
- Dashboard and Charts: Visual representations of valuation results and underlying assumptions.
Disclaimer
All information, articles, and product details provided on this website are for general informational and educational purposes only. We do not claim any ownership over, nor do we intend to infringe upon, any trademarks, copyrights, logos, brand names, or other intellectual property mentioned or depicted on this site. Such intellectual property remains the property of its respective owners, and any references here are made solely for identification or informational purposes, without implying any affiliation, endorsement, or partnership.
We make no representations or warranties, express or implied, regarding the accuracy, completeness, or suitability of any content or products presented. Nothing on this website should be construed as legal, tax, investment, financial, medical, or other professional advice. In addition, no part of this site—including articles or product references—constitutes a solicitation, recommendation, endorsement, advertisement, or offer to buy or sell any securities, franchises, or other financial instruments, particularly in jurisdictions where such activity would be unlawful.
All content is of a general nature and may not address the specific circumstances of any individual or entity. It is not a substitute for professional advice or services. Any actions you take based on the information provided here are strictly at your own risk. You accept full responsibility for any decisions or outcomes arising from your use of this website and agree to release us from any liability in connection with your use of, or reliance upon, the content or products found herein.