
|
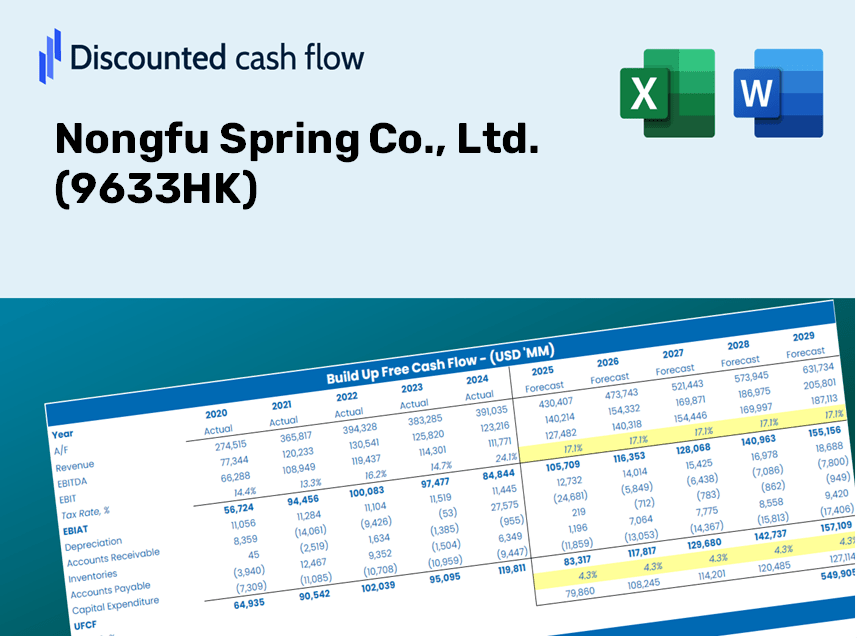
Nongfu Spring Co., Ltd. (9633.HK) DCF -Bewertung |
Fully Editable: Tailor To Your Needs In Excel Or Sheets
Professional Design: Trusted, Industry-Standard Templates
Investor-Approved Valuation Models
MAC/PC Compatible, Fully Unlocked
No Expertise Is Needed; Easy To Follow
Nongfu Spring Co., Ltd. (9633.HK) Bundle
Verbessern Sie Ihre Anlagestrategien mit dem DCF -Taschenrechner des Nongfu Spring Co., Ltd. (9633HK)! Erforschen Sie authentische Finanzdaten, passen Sie Wachstumsprojektionen und -kosten an und beachten Sie sofort, wie diese Modifikationen den inneren Wert der Nongfu Spring Co., Ltd. (9633HK) beeinflussen.
What You'll Receive
- Authentic Nongfu Spring Financials: Features historical performance and projected data for precise valuation.
- Customizable Parameters: Adjust WACC, tax rates, revenue growth, and capital expenses as needed.
- Real-Time Calculations: Intrinsic value and NPV are computed automatically.
- Scenario Exploration: Analyze various scenarios to assess the future outlook for Nongfu Spring.
- User-Friendly Interface: Designed for industry professionals while remaining approachable for newcomers.
Key Features
- Comprehensive DCF Calculator: Features detailed unlevered and levered DCF valuation models tailored for Nongfu Spring Co., Ltd. (9633HK).
- WACC Calculator: A user-friendly Weighted Average Cost of Capital sheet with flexible input options.
- Customizable Forecast Assumptions: Adjust growth rates, capital expenditures, and discount rates as needed.
- Integrated Financial Ratios: Evaluate profitability, leverage, and efficiency ratios specifically for Nongfu Spring Co., Ltd. (9633HK).
- Interactive Dashboard and Charts: Visual representations that summarize essential valuation metrics for straightforward analysis.
How It Functions
- Step 1: Download the Excel spreadsheet.
- Step 2: Examine Nongfu Spring Co., Ltd.'s pre-populated financial figures and projections.
- Step 3: Adjust key variables such as sales growth, WACC, and tax rates (highlighted cells).
- Step 4: Observe the DCF model refresh in real-time as you modify your assumptions.
- Step 5: Evaluate the outputs and leverage the findings for your investment strategies.
Why Choose Nongfu Spring's Calculator?
- Precision: Utilizes accurate financial data from Nongfu Spring for dependable results.
- Customizable: Allows users to easily experiment with and alter inputs to meet their needs.
- Efficient: Bypass the complexity of creating a financial model from the ground up.
- High-Quality: Crafted with the level of detail and functionality expected from a leading firm.
- Accessible: Intuitive design makes it suitable for users with varying levels of financial expertise.
Who Should Consider Using Nongfu Spring Co., Ltd. (9633HK)?
- Institutional Investors: Develop comprehensive and trustworthy valuation models for evaluating their investment portfolios.
- Corporate Finance Departments: Assess valuation scenarios to inform strategic decision-making within the company.
- Financial Consultants and Advisors: Equip clients with precise valuation analyses for Nongfu Spring Co., Ltd. (9633HK) stock.
- Students and Educators: Utilize real-world financial data to enhance learning and practice in financial modeling.
- Beverage Industry Enthusiasts: Gain insights into the valuation processes of leading companies like Nongfu Spring Co., Ltd. (9633HK) in the market.
Contents of the Template
- Pre-Filled Data: Includes Nongfu Spring Co., Ltd.'s historical financial information and projections.
- Discounted Cash Flow Model: An editable DCF valuation model featuring automatic calculations.
- Weighted Average Cost of Capital (WACC): A dedicated worksheet for calculating WACC using customized inputs.
- Key Financial Ratios: Examine Nongfu Spring Co., Ltd.'s profitability, efficiency, and leverage metrics.
- Customizable Inputs: Effortlessly modify revenue growth, margins, and tax rates.
- Clear Dashboard: Visual displays and tables summarizing important valuation outcomes.
Disclaimer
All information, articles, and product details provided on this website are for general informational and educational purposes only. We do not claim any ownership over, nor do we intend to infringe upon, any trademarks, copyrights, logos, brand names, or other intellectual property mentioned or depicted on this site. Such intellectual property remains the property of its respective owners, and any references here are made solely for identification or informational purposes, without implying any affiliation, endorsement, or partnership.
We make no representations or warranties, express or implied, regarding the accuracy, completeness, or suitability of any content or products presented. Nothing on this website should be construed as legal, tax, investment, financial, medical, or other professional advice. In addition, no part of this site—including articles or product references—constitutes a solicitation, recommendation, endorsement, advertisement, or offer to buy or sell any securities, franchises, or other financial instruments, particularly in jurisdictions where such activity would be unlawful.
All content is of a general nature and may not address the specific circumstances of any individual or entity. It is not a substitute for professional advice or services. Any actions you take based on the information provided here are strictly at your own risk. You accept full responsibility for any decisions or outcomes arising from your use of this website and agree to release us from any liability in connection with your use of, or reliance upon, the content or products found herein.