
|
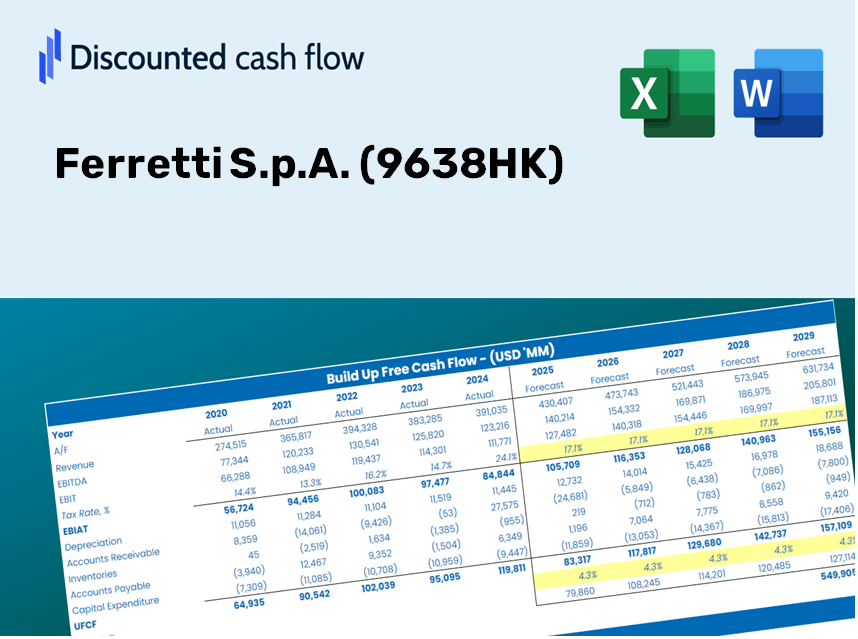
Ferretti S.P.A. (9638.HK) DCF -Bewertung |
Fully Editable: Tailor To Your Needs In Excel Or Sheets
Professional Design: Trusted, Industry-Standard Templates
Investor-Approved Valuation Models
MAC/PC Compatible, Fully Unlocked
No Expertise Is Needed; Easy To Follow
Ferretti S.p.A. (9638.HK) Bundle
Vereinfachen Sie die Bewertung der Ferretti S.P.A. (9638HK) mit diesem anpassbaren DCF -Taschenrechner! Mit Real Ferretti S.P.A. (9638HK) Finanzdaten und einstellbaren Prognoseeingaben können Sie Szenarien testen und Ferretti S.P.A. (9638HK) in Minuten faire Wert aufdecken.
Discounted Cash Flow (DCF) - (USD MM)
| Year | AY1 2020 |
AY2 2021 |
AY3 2022 |
AY4 2023 |
AY5 2024 |
FY1 2025 |
FY2 2026 |
FY3 2027 |
FY4 2028 |
FY5 2029 |
|---|---|---|---|---|---|---|---|---|---|---|
| Revenue | 5,478.1 | 8,562.2 | 9,230.3 | 10,165.6 | 11,973.4 | 14,727.8 | 18,115.8 | 22,283.3 | 27,409.4 | 33,714.8 |
| Revenue Growth, % | 0 | 56.3 | 7.8 | 10.13 | 17.78 | 23 | 23 | 23 | 23 | 23 |
| EBITDA | 467.6 | 841.9 | 1,126.4 | 1,515.0 | 1,622.1 | 1,738.5 | 2,138.5 | 2,630.4 | 3,235.5 | 3,979.9 |
| EBITDA, % | 8.54 | 9.83 | 12.2 | 14.9 | 13.55 | 11.8 | 11.8 | 11.8 | 11.8 | 11.8 |
| Depreciation | 380.8 | 434.8 | 475.7 | 566.0 | 595.4 | 816.6 | 1,004.4 | 1,235.5 | 1,519.7 | 1,869.3 |
| Depreciation, % | 6.95 | 5.08 | 5.15 | 5.57 | 4.97 | 5.54 | 5.54 | 5.54 | 5.54 | 5.54 |
| EBIT | 86.9 | 407.1 | 650.7 | 948.9 | 1,026.7 | 921.9 | 1,134.0 | 1,394.9 | 1,715.8 | 2,110.5 |
| EBIT, % | 1.59 | 4.76 | 7.05 | 9.33 | 8.57 | 6.26 | 6.26 | 6.26 | 6.26 | 6.26 |
| Total Cash | 294.2 | 1,550.3 | 3,593.4 | 2,814.6 | 1,395.6 | 2,997.1 | 3,686.6 | 4,534.6 | 5,577.8 | 6,860.9 |
| Total Cash, percent | .0 | .0 | .0 | .0 | .0 | .0 | .0 | .0 | .0 | .0 |
| Account Receivables | 1,687.2 | 1,083.5 | 1,186.2 | 1,696.0 | 2,213.1 | 2,694.3 | 3,314.2 | 4,076.6 | 5,014.4 | 6,167.9 |
| Account Receivables, % | 30.8 | 12.65 | 12.85 | 16.68 | 18.48 | 18.29 | 18.29 | 18.29 | 18.29 | 18.29 |
| Inventories | 1,585.5 | 1,293.8 | 2,126.1 | 3,026.3 | 3,974.9 | 3,830.8 | 4,712.1 | 5,796.1 | 7,129.4 | 8,769.5 |
| Inventories, % | 28.94 | 15.11 | 23.03 | 29.77 | 33.2 | 26.01 | 26.01 | 26.01 | 26.01 | 26.01 |
| Accounts Payable | 1,993.5 | 2,138.8 | 2,595.5 | 3,529.7 | 3,826.4 | 4,600.0 | 5,658.2 | 6,959.9 | 8,561.0 | 10,530.4 |
| Accounts Payable, % | 36.39 | 24.98 | 28.12 | 34.72 | 31.96 | 31.23 | 31.23 | 31.23 | 31.23 | 31.23 |
| Capital Expenditure | -647.7 | -683.8 | -729.9 | -1,370.5 | -1,103.4 | -1,485.0 | -1,826.6 | -2,246.7 | -2,763.6 | -3,399.3 |
| Capital Expenditure, % | -11.82 | -7.99 | -7.91 | -13.48 | -9.22 | -10.08 | -10.08 | -10.08 | -10.08 | -10.08 |
| Tax Rate, % | 30.43 | 30.43 | 30.43 | 30.43 | 30.43 | 30.43 | 30.43 | 30.43 | 30.43 | 30.43 |
| EBITAT | 542.0 | 375.8 | 565.2 | 757.6 | 714.2 | 790.3 | 972.0 | 1,195.7 | 1,470.7 | 1,809.1 |
| Depreciation | ||||||||||
| Changes in Account Receivables | ||||||||||
| Changes in Inventories | ||||||||||
| Changes in Accounts Payable | ||||||||||
| Capital Expenditure | ||||||||||
| UFCF | -1,004.1 | 1,167.4 | -167.3 | -522.5 | -962.8 | 558.3 | -292.9 | -360.3 | -443.2 | -545.2 |
| WACC, % | 6.2 | 6.18 | 6.16 | 6.13 | 6.1 | 6.15 | 6.15 | 6.15 | 6.15 | 6.15 |
| PV UFCF | ||||||||||
| SUM PV UFCF | -788.7 | |||||||||
| Long Term Growth Rate, % | 2.00 | |||||||||
| Free cash flow (T + 1) | -556 | |||||||||
| Terminal Value | -13,392 | |||||||||
| Present Terminal Value | -9,936 | |||||||||
| Enterprise Value | -10,724 | |||||||||
| Net Debt | -1,100 | |||||||||
| Equity Value | -9,624 | |||||||||
| Diluted Shares Outstanding, MM | 338 | |||||||||
| Equity Value Per Share | -28.43 |
Benefits You Will Receive
- Customizable Forecast Inputs: Effortlessly modify key assumptions (growth %, margins, WACC) to explore various scenarios.
- Realistic Financial Data: Ferretti S.p.A.'s financial information pre-loaded to facilitate your analysis.
- Automated DCF Calculations: The template computes Net Present Value (NPV) and intrinsic value automatically.
- Professional and Flexible: A sleek Excel model tailored to meet your valuation requirements.
- Designed for Analysts and Investors: Perfect for testing forecasts, assessing strategies, and optimizing your time.
Key Features
- Customizable Forecast Inputs: Adjust vital metrics such as revenue growth, EBITDA %, and capital expenditures for Ferretti S.p.A. (9638HK).
- Instant DCF Valuation: Automatically computes intrinsic value, NPV, and other financial metrics in real-time.
- High-Precision Accuracy: Leverages Ferretti's actual financial data to deliver realistic valuation results.
- Simplified Scenario Analysis: Effortlessly explore various assumptions and assess their impacts.
- Efficiency Booster: Avoid the hassle of constructing intricate valuation models from the ground up.
How It Works
- Step 1: Download the Excel file.
- Step 2: Review the pre-filled data for Ferretti S.p.A. (9638HK) including historical and projected figures.
- Step 3: Modify key assumptions (highlighted in yellow) according to your findings.
- Step 4: Observe real-time recalculations of Ferretti’s intrinsic value.
- Step 5: Utilize the results for investment decisions or reporting purposes.
Why Opt for This Calculator?
- User-Friendly Design: Perfectly crafted for both novices and seasoned pros.
- Customizable Inputs: Easily tweak parameters to suit your financial analysis.
- Real-Time Updates: Witness immediate changes in Ferretti S.p.A.’s valuation as you modify your inputs.
- Preloaded Data: Comes equipped with Ferretti S.p.A.'s (9638HK) actual financial metrics for swift analysis.
- Preferred by Experts: Utilized by investors and analysts for making well-informed choices.
Who Can Benefit from Ferretti S.p.A. (9638HK)?
- Investors: Empower your investment choices with a top-tier valuation tool tailored for the boating industry.
- Financial Analysts: Streamline your analysis process with a customizable DCF model specifically designed for luxury yachts.
- Consultants: Easily modify the template for compelling presentations or reports for your clients in the marine sector.
- Boating Enthusiasts: Enhance your knowledge of valuation methods through real-life case studies in the luxury yacht market.
- Educators and Students: Utilize this resource as a hands-on learning tool in courses related to finance and marine business.
What the Template Includes
- Preloaded Ferretti S.p.A. Data: Historical and projected financial figures, encompassing revenue, EBIT, and capital expenditures.
- DCF and WACC Models: Professional-grade worksheets designed for calculating intrinsic value and Weighted Average Cost of Capital.
- Editable Inputs: Yellow-highlighted cells for modifying revenue growth, tax rates, and discount rates.
- Financial Statements: Detailed annual and quarterly financial reports for in-depth analysis.
- Key Ratios: Profitability, leverage, and efficiency ratios for assessing performance.
- Dashboard and Charts: Visual representations of valuation results and underlying assumptions.
Disclaimer
All information, articles, and product details provided on this website are for general informational and educational purposes only. We do not claim any ownership over, nor do we intend to infringe upon, any trademarks, copyrights, logos, brand names, or other intellectual property mentioned or depicted on this site. Such intellectual property remains the property of its respective owners, and any references here are made solely for identification or informational purposes, without implying any affiliation, endorsement, or partnership.
We make no representations or warranties, express or implied, regarding the accuracy, completeness, or suitability of any content or products presented. Nothing on this website should be construed as legal, tax, investment, financial, medical, or other professional advice. In addition, no part of this site—including articles or product references—constitutes a solicitation, recommendation, endorsement, advertisement, or offer to buy or sell any securities, franchises, or other financial instruments, particularly in jurisdictions where such activity would be unlawful.
All content is of a general nature and may not address the specific circumstances of any individual or entity. It is not a substitute for professional advice or services. Any actions you take based on the information provided here are strictly at your own risk. You accept full responsibility for any decisions or outcomes arising from your use of this website and agree to release us from any liability in connection with your use of, or reliance upon, the content or products found herein.