
|
Tianqi Lithium Corporation (9696.HK) DCF -Bewertung |
Fully Editable: Tailor To Your Needs In Excel Or Sheets
Professional Design: Trusted, Industry-Standard Templates
Investor-Approved Valuation Models
MAC/PC Compatible, Fully Unlocked
No Expertise Is Needed; Easy To Follow
Tianqi Lithium Corporation (9696.HK) Bundle
Möchten Sie den inneren Wert der Tianqi Lithium Corporation bestimmen? Unser (9696HK) DCF-Taschenrechner integriert reale Daten mit umfangreichen Anpassungsfunktionen, sodass Sie Ihre Prognosen verfeinern und fundiertere Investitionsentscheidungen treffen können.
Discounted Cash Flow (DCF) - (USD MM)
| Year | AY1 2020 |
AY2 2021 |
AY3 2022 |
AY4 2023 |
AY5 2024 |
FY1 2025 |
FY2 2026 |
FY3 2027 |
FY4 2028 |
FY5 2029 |
|---|---|---|---|---|---|---|---|---|---|---|
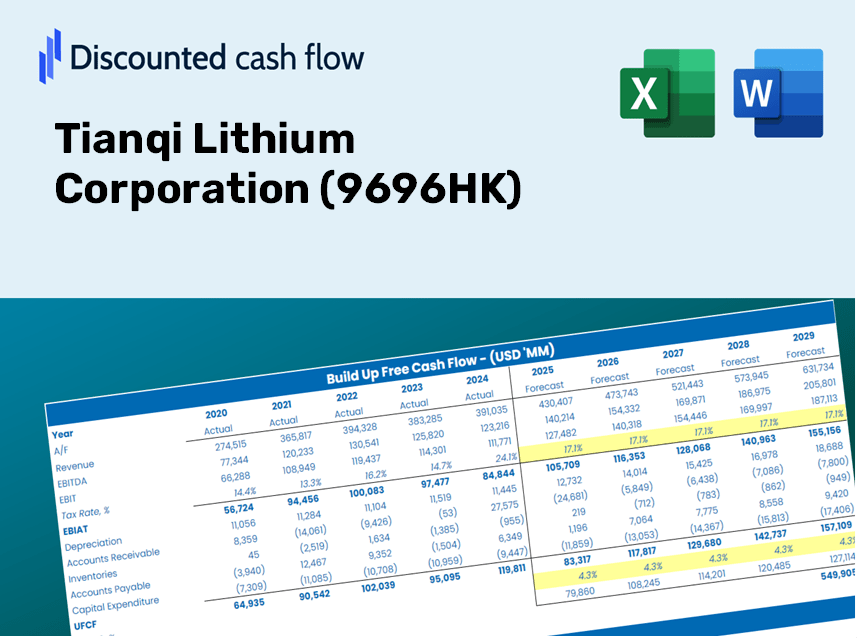
| Revenue | 3,522.4 | 8,395.4 | 44,006.3 | 44,312.3 | 14,311.4 | 19,069.7 | 25,410.0 | 33,858.4 | 45,115.6 | 60,115.7 |
| Revenue Growth, % | 0 | 138.34 | 424.17 | 0.69551 | -67.7 | 33.25 | 33.25 | 33.25 | 33.25 | 33.25 |
| EBITDA | 1,270.3 | 5,026.3 | 45,425.5 | 41,257.8 | 5,956.1 | 12,611.1 | 16,804.0 | 22,391.0 | 29,835.5 | 39,755.3 |
| EBITDA, % | 36.06 | 59.87 | 103.23 | 93.11 | 41.62 | 66.13 | 66.13 | 66.13 | 66.13 | 66.13 |
| Depreciation | 413.3 | 449.0 | 717.7 | 928.7 | 1,011.8 | 1,063.3 | 1,416.8 | 1,887.8 | 2,515.5 | 3,351.9 |
| Depreciation, % | 11.73 | 5.35 | 1.63 | 2.1 | 7.07 | 5.58 | 5.58 | 5.58 | 5.58 | 5.58 |
| EBIT | 856.9 | 4,577.3 | 44,707.9 | 40,329.1 | 4,944.3 | 11,610.0 | 15,470.1 | 20,613.6 | 27,467.2 | 36,599.5 |
| EBIT, % | 24.33 | 54.52 | 101.59 | 91.01 | 34.55 | 60.88 | 60.88 | 60.88 | 60.88 | 60.88 |
| Total Cash | 1,089.1 | 2,181.4 | 13,651.4 | 10,238.1 | 7,035.8 | 6,109.6 | 8,140.9 | 10,847.6 | 14,454.2 | 19,260.0 |
| Total Cash, percent | .0 | .0 | .0 | .0 | .0 | .0 | .0 | .0 | .0 | .0 |
| Account Receivables | 883.9 | 3,407.8 | 11,490.5 | 377.7 | 2,484.8 | 4,195.8 | 5,590.8 | 7,449.6 | 9,926.5 | 13,226.8 |
| Account Receivables, % | 25.09 | 40.59 | 26.11 | 0.85243 | 17.36 | 22 | 22 | 22 | 22 | 22 |
| Inventories | 932.3 | 955.0 | 2,348.8 | 3,451.5 | 2,507.7 | 2,612.3 | 3,480.8 | 4,638.2 | 6,180.3 | 8,235.1 |
| Inventories, % | 26.47 | 11.38 | 5.34 | 7.79 | 17.52 | 13.7 | 13.7 | 13.7 | 13.7 | 13.7 |
| Accounts Payable | 808.9 | 973.5 | 2,564.3 | 1,724.2 | 1,288.2 | 2,032.0 | 2,707.6 | 3,607.9 | 4,807.4 | 6,405.8 |
| Accounts Payable, % | 22.96 | 11.6 | 5.83 | 3.89 | 9 | 10.66 | 10.66 | 10.66 | 10.66 | 10.66 |
| Capital Expenditure | -1,054.8 | -1,096.5 | -1,880.0 | -4,867.4 | -4,956.7 | -3,543.1 | -4,721.1 | -6,290.8 | -8,382.4 | -11,169.3 |
| Capital Expenditure, % | -29.95 | -13.06 | -4.27 | -10.98 | -34.63 | -18.58 | -18.58 | -18.58 | -18.58 | -18.58 |
| Tax Rate, % | 711.84 | 711.84 | 711.84 | 711.84 | 711.84 | 711.84 | 711.84 | 711.84 | 711.84 | 711.84 |
| EBITAT | 1,489.5 | 4,214.2 | 26,947.0 | 8,094.6 | -30,251.1 | 6,325.4 | 8,428.4 | 11,230.7 | 14,964.7 | 19,940.2 |
| Depreciation | ||||||||||
| Changes in Account Receivables | ||||||||||
| Changes in Inventories | ||||||||||
| Changes in Accounts Payable | ||||||||||
| Capital Expenditure | ||||||||||
| UFCF | -159.5 | 1,184.7 | 17,899.1 | 13,325.7 | -35,795.1 | 2,773.7 | 3,536.2 | 4,711.9 | 6,278.5 | 8,365.9 |
| WACC, % | 6.44 | 6.39 | 6.2 | 5.96 | 5.84 | 6.17 | 6.17 | 6.17 | 6.17 | 6.17 |
| PV UFCF | ||||||||||
| SUM PV UFCF | 20,830.4 | |||||||||
| Long Term Growth Rate, % | 2.00 | |||||||||
| Free cash flow (T + 1) | 8,533 | |||||||||
| Terminal Value | 204,677 | |||||||||
| Present Terminal Value | 151,733 | |||||||||
| Enterprise Value | 172,563 | |||||||||
| Net Debt | 10,031 | |||||||||
| Equity Value | 162,532 | |||||||||
| Diluted Shares Outstanding, MM | 1,640 | |||||||||
| Equity Value Per Share | 99.11 |
Your Benefits
- Authentic Tianqi Data: Comprehensive financials – from revenue to EBIT – derived from actual and projected statistics.
- Complete Customization: Modify all essential parameters (yellow cells) such as WACC, growth %, and tax rates.
- Real-Time Valuation Updates: Automatic recalculations to understand the effects of adjustments on Tianqi Lithium's fair value.
- Flexible Excel Template: Designed for quick modifications, scenario analysis, and in-depth projections.
- Efficient and Precise: Avoid the hassle of building models from the ground up while ensuring accuracy and adaptability.
Key Features
- Pre-Loaded Data: Historical financial statements and pre-filled forecasts for Tianqi Lithium Corporation (9696HK).
- Fully Adjustable Inputs: Modify WACC, tax rates, revenue growth, and EBITDA margins as needed.
- Instant Results: Watch the intrinsic value of Tianqi Lithium Corporation (9696HK) update in real time.
- Clear Visual Outputs: Dashboard charts effectively showcase valuation results and essential metrics.
- Built for Accuracy: A specialized tool designed for analysts, investors, and finance professionals.
How It Works
- 1. Access the Template: Download and open the Excel file containing Tianqi Lithium Corporation’s (9696HK) preloaded data.
- 2. Adjust Key Assumptions: Modify essential inputs such as growth projections, WACC, and capital expenditure figures.
- 3. Get Instant Results: The DCF model will automatically compute the intrinsic value and NPV in real-time.
- 4. Explore Different Scenarios: Evaluate various forecasts to understand diverse valuation results.
- 5. Present with Confidence: Deliver professional valuation insights to enhance your decision-making process.
Why Select the Tianqi Lithium Corporation (9696HK) Calculator?
- Time-Saving: Our calculator is user-friendly and ready for immediate use, eliminating the need for a custom DCF model.
- Enhanced Accuracy: Access to dependable financial data and precise formulas minimizes valuation errors.
- Fully Customizable: Adjust the model to align with your specific assumptions and forecasts.
- User-Friendly: Intuitive charts and outputs simplify the interpretation of results.
- Endorsed by Professionals: Crafted for industry experts who prioritize accuracy and ease of use.
Who Can Benefit from This Product?
- Finance Students: Master valuation techniques and apply them using actual market data.
- Researchers: Utilize professional models in your academic projects or studies.
- Investors: Evaluate your investment strategies and analyze valuation results for Tianqi Lithium Corporation (9696HK).
- Market Analysts: Enhance your efficiency with a customizable DCF model designed for your needs.
- Entrepreneurs: Discover how major public companies like Tianqi Lithium Corporation (9696HK) are assessed in the market.
Contents of the Template
- Operating and Balance Sheet Data: Pre-filled historical data and forecasts for Tianqi Lithium Corporation (9696HK), including revenue, EBITDA, EBIT, and capital expenditures.
- WACC Calculation: A dedicated sheet for Weighted Average Cost of Capital (WACC), featuring parameters such as Beta, risk-free rate, and share price.
- DCF Valuation (Unlevered and Levered): Customizable Discounted Cash Flow models illustrating intrinsic value with comprehensive calculations.
- Financial Statements: Pre-loaded annual and quarterly financial statements to facilitate analysis.
- Key Ratios: Includes profitability, leverage, and efficiency ratios specific to Tianqi Lithium Corporation (9696HK).
- Dashboard and Charts: Visual representation of valuation outputs and assumptions for easy result analysis.
Disclaimer
All information, articles, and product details provided on this website are for general informational and educational purposes only. We do not claim any ownership over, nor do we intend to infringe upon, any trademarks, copyrights, logos, brand names, or other intellectual property mentioned or depicted on this site. Such intellectual property remains the property of its respective owners, and any references here are made solely for identification or informational purposes, without implying any affiliation, endorsement, or partnership.
We make no representations or warranties, express or implied, regarding the accuracy, completeness, or suitability of any content or products presented. Nothing on this website should be construed as legal, tax, investment, financial, medical, or other professional advice. In addition, no part of this site—including articles or product references—constitutes a solicitation, recommendation, endorsement, advertisement, or offer to buy or sell any securities, franchises, or other financial instruments, particularly in jurisdictions where such activity would be unlawful.
All content is of a general nature and may not address the specific circumstances of any individual or entity. It is not a substitute for professional advice or services. Any actions you take based on the information provided here are strictly at your own risk. You accept full responsibility for any decisions or outcomes arising from your use of this website and agree to release us from any liability in connection with your use of, or reliance upon, the content or products found herein.