
|
DAISEKI CO., LTD. (9793.t) DCF -Bewertung |
Fully Editable: Tailor To Your Needs In Excel Or Sheets
Professional Design: Trusted, Industry-Standard Templates
Investor-Approved Valuation Models
MAC/PC Compatible, Fully Unlocked
No Expertise Is Needed; Easy To Follow
Daiseki Co.,Ltd. (9793.T) Bundle
Bewerten Sie die finanziellen Aussichten von Daiseki Co., Ltd. wie ein Experte! Dieser (9793T) DCF-Taschenrechner bietet vorgefüllte Finanzdaten und bietet eine vollständige Flexibilität, um das Umsatzwachstum, WACC, Margen und andere kritische Annahmen zu ändern, um sich an Ihren Projektionen anzupassen.
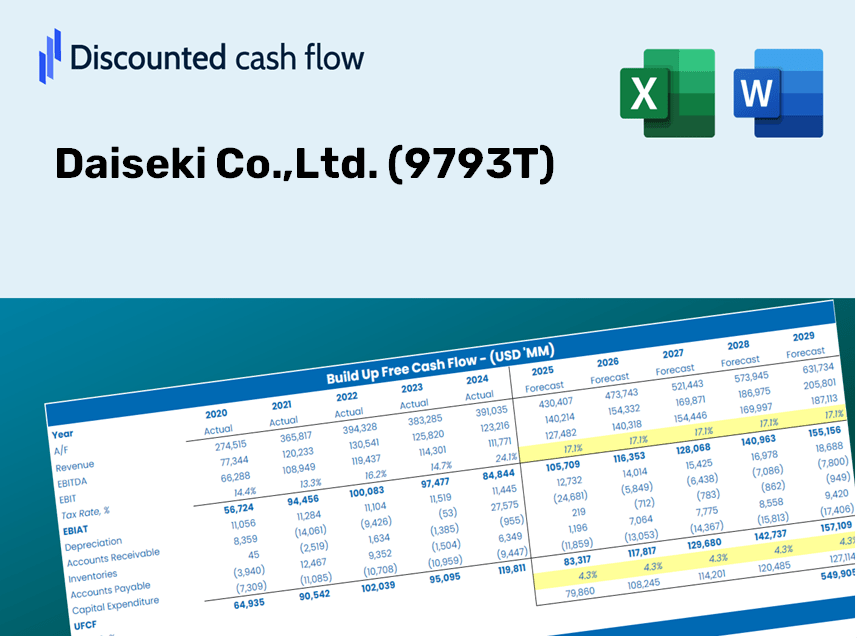
Discounted Cash Flow (DCF) - (USD MM)
| Year | AY1 2021 |
AY2 2022 |
AY3 2023 |
AY4 2024 |
AY5 2025 |
FY1 2026 |
FY2 2027 |
FY3 2028 |
FY4 2029 |
FY5 2030 |
|---|---|---|---|---|---|---|---|---|---|---|
| Revenue | 51,530.0 | 56,867.0 | 58,572.0 | 69,216.0 | 67,304.0 | 72,144.1 | 77,332.2 | 82,893.4 | 88,854.6 | 95,244.5 |
| Revenue Growth, % | 0 | 10.36 | 3 | 18.17 | -2.76 | 7.19 | 7.19 | 7.19 | 7.19 | 7.19 |
| EBITDA | 12,521.0 | 15,502.0 | 15,482.0 | 18,254.0 | 18,258.0 | 18,972.6 | 20,337.0 | 21,799.5 | 23,367.2 | 25,047.6 |
| EBITDA, % | 24.3 | 27.26 | 26.43 | 26.37 | 27.13 | 26.3 | 26.3 | 26.3 | 26.3 | 26.3 |
| Depreciation | 2,450.0 | 2,460.0 | 2,466.0 | 3,036.0 | 3,547.0 | 3,311.0 | 3,549.1 | 3,804.3 | 4,077.9 | 4,371.1 |
| Depreciation, % | 4.75 | 4.33 | 4.21 | 4.39 | 5.27 | 4.59 | 4.59 | 4.59 | 4.59 | 4.59 |
| EBIT | 10,071.0 | 13,042.0 | 13,016.0 | 15,218.0 | 14,711.0 | 15,661.6 | 16,787.9 | 17,995.2 | 19,289.3 | 20,676.5 |
| EBIT, % | 19.54 | 22.93 | 22.22 | 21.99 | 21.86 | 21.71 | 21.71 | 21.71 | 21.71 | 21.71 |
| Total Cash | 34,255.0 | 34,449.0 | 27,850.0 | 29,162.0 | 30,916.0 | 37,900.0 | 40,625.6 | 43,547.1 | 46,678.7 | 50,035.6 |
| Total Cash, percent | .0 | .0 | .0 | .0 | .0 | .0 | .0 | .0 | .0 | .0 |
| Account Receivables | 8,910.0 | 9,554.0 | 10,461.0 | 12,242.0 | 12,909.0 | 12,815.4 | 13,737.0 | 14,724.9 | 15,783.8 | 16,918.9 |
| Account Receivables, % | 17.29 | 16.8 | 17.86 | 17.69 | 19.18 | 17.76 | 17.76 | 17.76 | 17.76 | 17.76 |
| Inventories | 1,862.0 | 1,906.0 | 1,948.0 | 2,609.0 | 2,138.0 | 2,487.1 | 2,665.9 | 2,857.7 | 3,063.2 | 3,283.4 |
| Inventories, % | 3.61 | 3.35 | 3.33 | 3.77 | 3.18 | 3.45 | 3.45 | 3.45 | 3.45 | 3.45 |
| Accounts Payable | 3,542.0 | 3,796.0 | 4,358.0 | 3,944.0 | 5,061.0 | 4,935.7 | 5,290.6 | 5,671.1 | 6,078.9 | 6,516.1 |
| Accounts Payable, % | 6.87 | 6.68 | 7.44 | 5.7 | 7.52 | 6.84 | 6.84 | 6.84 | 6.84 | 6.84 |
| Capital Expenditure | -2,667.0 | -3,356.0 | -6,169.0 | -6,268.0 | -8,248.0 | -6,192.8 | -6,638.2 | -7,115.6 | -7,627.3 | -8,175.8 |
| Capital Expenditure, % | -5.18 | -5.9 | -10.53 | -9.06 | -12.25 | -8.58 | -8.58 | -8.58 | -8.58 | -8.58 |
| Tax Rate, % | 36.58 | 36.58 | 36.58 | 36.58 | 36.58 | 36.58 | 36.58 | 36.58 | 36.58 | 36.58 |
| EBITAT | 6,524.2 | 8,379.2 | 8,669.3 | 9,475.6 | 9,329.2 | 10,064.7 | 10,788.5 | 11,564.4 | 12,396.0 | 13,287.4 |
| Depreciation | ||||||||||
| Changes in Account Receivables | ||||||||||
| Changes in Inventories | ||||||||||
| Changes in Accounts Payable | ||||||||||
| Capital Expenditure | ||||||||||
| UFCF | -922.8 | 7,049.2 | 4,579.3 | 3,387.6 | 5,549.2 | 6,802.0 | 6,953.9 | 7,454.0 | 7,990.0 | 8,564.6 |
| WACC, % | 4.89 | 4.89 | 4.89 | 4.89 | 4.89 | 4.89 | 4.89 | 4.89 | 4.89 | 4.89 |
| PV UFCF | ||||||||||
| SUM PV UFCF | 32,612.0 | |||||||||
| Long Term Growth Rate, % | 2.00 | |||||||||
| Free cash flow (T + 1) | 8,736 | |||||||||
| Terminal Value | 302,326 | |||||||||
| Present Terminal Value | 238,130 | |||||||||
| Enterprise Value | 270,742 | |||||||||
| Net Debt | -24,382 | |||||||||
| Equity Value | 295,124 | |||||||||
| Diluted Shares Outstanding, MM | 48 | |||||||||
| Equity Value Per Share | 6,131.94 |
What You Will Receive
- Authentic Daiseki Financials: Access to historical and projected data for precise valuation.
- Customizable Inputs: Adjust WACC, tax rates, revenue growth, and capital expenditures as needed.
- Automated Calculations: Dynamic computation of intrinsic value and NPV.
- Scenario Analysis: Explore various scenarios to assess Daiseki's future performance.
- User-Friendly Design: Designed for professionals but easy for newcomers to navigate.
Key Features
- Pre-Loaded Data: Daiseki Co., Ltd.'s historical financial statements and pre-filled forecasts.
- Fully Adjustable Inputs: Customize WACC, tax rates, revenue growth, and EBITDA margins.
- Instant Results: View Daiseki Co., Ltd.'s intrinsic value recalculated in real time.
- Clear Visual Outputs: Dashboard charts present valuation results and key metrics.
- Built for Accuracy: A professional tool designed for analysts, investors, and finance experts.
How It Operates
- 1. Access the Template: Download and open the Excel file featuring Daiseki Co.,Ltd.'s (9793T) preloaded data.
- 2. Modify Assumptions: Adjust essential inputs such as growth rates, WACC, and capital expenditures.
- 3. View Results in Real-Time: The DCF model automatically computes intrinsic value and NPV.
- 4. Evaluate Different Scenarios: Analyze various forecasts to explore diverse valuation outcomes.
- 5. Present with Assurance: Deliver professional valuation insights to inform your decision-making.
Why Choose Daiseki Co., Ltd. (9793T) Calculator?
- Reliable Data: Access authentic financial information for Daiseki Co., Ltd. to ensure trustworthy valuation outcomes.
- Customizable Options: Tailor essential metrics such as growth rates, WACC, and tax rates to fit your financial forecasts.
- Efficiency: Built-in calculations save you time and eliminate the need to start from ground zero.
- Professional Tool: Crafted for use by investors, analysts, and consultants in the field.
- User-Friendly Design: Easy-to-navigate layout with clear, step-by-step guidance for all users.
Who Should Use Daiseki Co., Ltd. (9793T)?
- Individual Investors: Make informed choices regarding buying or selling shares of Daiseki Co., Ltd. (9793T).
- Financial Analysts: Enhance your valuation processes with pre-built financial models tailored for Daiseki Co., Ltd. (9793T).
- Consultants: Provide clients with accurate and timely valuation insights related to Daiseki Co., Ltd. (9793T).
- Business Owners: Gain insights into how companies like Daiseki Co., Ltd. (9793T) are valued to inform your own business strategies.
- Finance Students: Explore valuation techniques using real-world data and examples from Daiseki Co., Ltd. (9793T).
Contents of the Template
- Comprehensive DCF Model: Fully editable template featuring detailed valuation metrics.
- Real-World Data: Daiseki Co., Ltd.'s historical and projected financial information preloaded for your analysis.
- Customizable Parameters: Modify WACC, growth rates, and tax assumptions to explore various scenarios.
- Financial Statements: Complete annual and quarterly breakdowns for enhanced insights.
- Key Ratios: Integrated analysis of profitability, efficiency, and leverage metrics.
- Dashboard with Visual Outputs: A collection of charts and tables providing clear, actionable insights.
Disclaimer
All information, articles, and product details provided on this website are for general informational and educational purposes only. We do not claim any ownership over, nor do we intend to infringe upon, any trademarks, copyrights, logos, brand names, or other intellectual property mentioned or depicted on this site. Such intellectual property remains the property of its respective owners, and any references here are made solely for identification or informational purposes, without implying any affiliation, endorsement, or partnership.
We make no representations or warranties, express or implied, regarding the accuracy, completeness, or suitability of any content or products presented. Nothing on this website should be construed as legal, tax, investment, financial, medical, or other professional advice. In addition, no part of this site—including articles or product references—constitutes a solicitation, recommendation, endorsement, advertisement, or offer to buy or sell any securities, franchises, or other financial instruments, particularly in jurisdictions where such activity would be unlawful.
All content is of a general nature and may not address the specific circumstances of any individual or entity. It is not a substitute for professional advice or services. Any actions you take based on the information provided here are strictly at your own risk. You accept full responsibility for any decisions or outcomes arising from your use of this website and agree to release us from any liability in connection with your use of, or reliance upon, the content or products found herein.