
|
Zhejiang Leapmotor Technology Co., Ltd. (9863.HK) DCF -Bewertung |
Fully Editable: Tailor To Your Needs In Excel Or Sheets
Professional Design: Trusted, Industry-Standard Templates
Investor-Approved Valuation Models
MAC/PC Compatible, Fully Unlocked
No Expertise Is Needed; Easy To Follow
Zhejiang Leapmotor Technology Co., Ltd. (9863.HK) Bundle
Unabhängig davon, ob Sie ein Investor oder Analyst sind, ist dieser [Symbol] DCF -Taschenrechner Ihre wesentliche Ressource für eine genaue Bewertung. Mit Zhejiang Lespmotor Technology Co., Ltd. Real Data, können Sie Prognosen anpassen und die Auswirkungen in Echtzeit beobachten.
Discounted Cash Flow (DCF) - (USD MM)
| Year | AY1 2020 |
AY2 2021 |
AY3 2022 |
AY4 2023 |
AY5 2024 |
FY1 2025 |
FY2 2026 |
FY3 2027 |
FY4 2028 |
FY5 2029 |
|---|---|---|---|---|---|---|---|---|---|---|
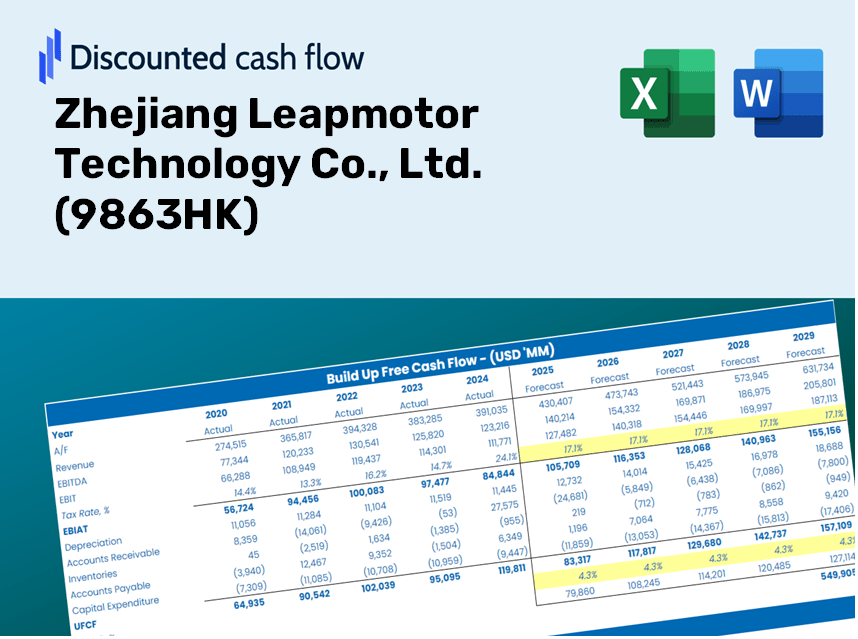
| Revenue | 689.8 | 3,422.0 | 13,531.3 | 18,297.2 | 35,142.1 | 63,895.8 | 116,176.1 | 211,232.7 | 384,065.6 | 698,312.4 |
| Revenue Growth, % | 0 | 396.13 | 295.41 | 35.22 | 92.06 | 81.82 | 81.82 | 81.82 | 81.82 | 81.82 |
| EBITDA | -797.2 | -2,960.5 | -5,391.1 | -3,870.8 | -2,884.1 | -32,678.5 | -59,416.5 | -108,031.7 | -196,424.4 | -357,141.1 |
| EBITDA, % | -115.58 | -86.51 | -39.84 | -21.16 | -8.21 | -51.14 | -51.14 | -51.14 | -51.14 | -51.14 |
| Depreciation | 165.9 | 196.9 | 287.7 | 656.9 | 732.8 | 4,805.9 | 8,738.2 | 15,887.9 | 28,887.6 | 52,523.8 |
| Depreciation, % | 24.05 | 5.75 | 2.13 | 3.59 | 2.09 | 7.52 | 7.52 | 7.52 | 7.52 | 7.52 |
| EBIT | -963.1 | -3,157.4 | -5,678.8 | -4,527.7 | -3,616.9 | -34,410.6 | -62,565.7 | -113,757.7 | -206,835.5 | -376,070.7 |
| EBIT, % | -139.64 | -92.27 | -41.97 | -24.75 | -10.29 | -53.85 | -53.85 | -53.85 | -53.85 | -53.85 |
| Total Cash | 193.2 | 6,116.3 | 8,696.6 | 16,898.1 | 22,637.6 | 44,606.2 | 81,103.5 | 147,463.3 | 268,119.4 | 487,497.7 |
| Total Cash, percent | .0 | .0 | .0 | .0 | .0 | .0 | .0 | .0 | .0 | .0 |
| Account Receivables | 260.6 | 892.0 | 1,882.1 | 1,033.7 | 2,174.7 | 11,450.4 | 20,819.2 | 37,853.6 | 68,825.9 | 125,140.1 |
| Account Receivables, % | 37.79 | 26.07 | 13.91 | 5.65 | 6.19 | 17.92 | 17.92 | 17.92 | 17.92 | 17.92 |
| Inventories | 486.7 | 1,135.0 | 2,190.9 | 1,993.7 | 2,209.9 | 17,521.4 | 31,857.6 | 57,923.9 | 105,317.9 | 191,490.2 |
| Inventories, % | 70.57 | 33.17 | 16.19 | 10.9 | 6.29 | 27.42 | 27.42 | 27.42 | 27.42 | 27.42 |
| Accounts Payable | 807.3 | 2,836.5 | 6,541.0 | 10,758.6 | 20,653.6 | 44,573.6 | 81,044.2 | 147,355.5 | 267,923.4 | 487,141.3 |
| Accounts Payable, % | 117.05 | 82.89 | 48.34 | 58.8 | 58.77 | 69.76 | 69.76 | 69.76 | 69.76 | 69.76 |
| Capital Expenditure | -395.8 | -2,008.8 | -1,801.8 | -1,523.6 | -2,294.3 | -18,434.7 | -33,518.1 | -60,943.0 | -110,807.3 | -201,471.1 |
| Capital Expenditure, % | -57.38 | -58.7 | -13.32 | -8.33 | -6.53 | -28.85 | -28.85 | -28.85 | -28.85 | -28.85 |
| Tax Rate, % | -0.00283616 | -0.00283616 | -0.00283616 | -0.00283616 | -0.00283616 | -0.00283616 | -0.00283616 | -0.00283616 | -0.00283616 | -0.00283616 |
| EBITAT | -963.1 | -3,157.4 | -5,678.8 | -4,527.7 | -3,617.0 | -34,410.6 | -62,565.7 | -113,757.7 | -206,835.5 | -376,070.7 |
| Depreciation | ||||||||||
| Changes in Account Receivables | ||||||||||
| Changes in Inventories | ||||||||||
| Changes in Accounts Payable | ||||||||||
| Capital Expenditure | ||||||||||
| UFCF | -1,133.1 | -4,219.8 | -5,534.4 | -131.4 | 3,359.5 | -48,706.6 | -74,580.1 | -135,602.3 | -246,553.6 | -448,286.6 |
| WACC, % | 8.97 | 8.97 | 8.97 | 8.97 | 8.97 | 8.97 | 8.97 | 8.97 | 8.97 | 8.97 |
| PV UFCF | ||||||||||
| SUM PV UFCF | -678,999.9 | |||||||||
| Long Term Growth Rate, % | 2.00 | |||||||||
| Free cash flow (T + 1) | -457,252 | |||||||||
| Terminal Value | -6,563,599 | |||||||||
| Present Terminal Value | -4,272,453 | |||||||||
| Enterprise Value | -4,951,453 | |||||||||
| Net Debt | -4,012 | |||||||||
| Equity Value | -4,947,442 | |||||||||
| Diluted Shares Outstanding, MM | 1,337 | |||||||||
| Equity Value Per Share | -3,700.50 |
What You Will Receive
- Comprehensive Financial Model: Leapmotor’s actual data facilitates accurate DCF valuation for (9863HK).
- Complete Forecast Flexibility: Modify revenue growth rates, profit margins, WACC, and other critical variables.
- Real-Time Calculations: Automatic updates allow you to view results instantly as adjustments are made.
- Professional-Grade Template: An expertly designed Excel file, optimized for investor presentations.
- Flexible and Reusable: Customizable for various scenarios, allowing for thorough and repeatable forecasts.
Key Features
- 🔍 Real-Life 9863HK Financials: Pre-filled historical and projected data for Zhejiang Leapmotor Technology Co., Ltd.
- ✏️ Fully Customizable Inputs: Adjust all critical parameters (yellow cells) such as WACC, growth %, and tax rates.
- 📊 Professional DCF Valuation: Built-in formulas calculate the intrinsic value of Zhejiang Leapmotor using the Discounted Cash Flow method.
- ⚡ Instant Results: Visualize the valuation of Zhejiang Leapmotor instantly after making adjustments.
- Scenario Analysis: Evaluate and compare different outcomes based on various financial assumptions side-by-side.
How It Functions
- 1. Access the Template: Download and open the Excel file containing Zhejiang Leapmotor Technology Co., Ltd.'s preloaded data.
- 2. Adjust Assumptions: Modify essential inputs such as growth rates, WACC, and capital expenditures.
- 3. View Results in Real-Time: The DCF model automatically calculates the intrinsic value and NPV.
- 4. Explore Scenarios: Analyze various forecasts to evaluate different valuation scenarios.
- 5. Present with Assurance: Deliver professional valuation insights to bolster your decision-making process.
Why Choose This Calculator for Zhejiang Leapmotor Technology Co., Ltd. (9863HK)?
- Accurate Financial Insights: Use real financial data from Leapmotor for trustworthy valuation outcomes.
- Fully Customizable: Tailor essential variables such as growth rates, WACC, and tax rates to align with your forecasts.
- Efficiency Boost: Ready-to-use calculations save you time by avoiding the need to create models from the ground up.
- Professional-Quality Tool: Ideal for investors, analysts, and consultants looking for precise evaluations.
- Easy to Use: Designed with a user-friendly interface and comprehensive guidance for users of all experience levels.
Who Should Use This Product?
- Investors: Effectively assess the fair value of Zhejiang Leapmotor Technology Co., Ltd. (9863HK) prior to investment decisions.
- CFOs: Utilize a top-tier DCF model for comprehensive financial reporting and analysis.
- Consultants: Easily tailor the template for valuation reports tailored to client needs.
- Entrepreneurs: Acquire insights into the financial modeling techniques employed by leading companies.
- Educators: Implement it as a teaching resource to illustrate various valuation methodologies.
What the Template Contains
- Historical Data: Includes Zhejiang Leapmotor Technology Co., Ltd.'s (9863HK) past financial performance and baseline projections.
- DCF and Levered DCF Models: Comprehensive templates for assessing the intrinsic value of Zhejiang Leapmotor Technology Co., Ltd. (9863HK).
- WACC Sheet: Pre-constructed calculations for the Weighted Average Cost of Capital.
- Editable Inputs: Adjust essential drivers such as growth rates, EBITDA %, and CAPEX assumptions.
- Quarterly and Annual Statements: A thorough analysis of Zhejiang Leapmotor Technology Co., Ltd.'s (9863HK) financial statements.
- Interactive Dashboard: Dynamically visualize valuation results and forecasts.
Disclaimer
All information, articles, and product details provided on this website are for general informational and educational purposes only. We do not claim any ownership over, nor do we intend to infringe upon, any trademarks, copyrights, logos, brand names, or other intellectual property mentioned or depicted on this site. Such intellectual property remains the property of its respective owners, and any references here are made solely for identification or informational purposes, without implying any affiliation, endorsement, or partnership.
We make no representations or warranties, express or implied, regarding the accuracy, completeness, or suitability of any content or products presented. Nothing on this website should be construed as legal, tax, investment, financial, medical, or other professional advice. In addition, no part of this site—including articles or product references—constitutes a solicitation, recommendation, endorsement, advertisement, or offer to buy or sell any securities, franchises, or other financial instruments, particularly in jurisdictions where such activity would be unlawful.
All content is of a general nature and may not address the specific circumstances of any individual or entity. It is not a substitute for professional advice or services. Any actions you take based on the information provided here are strictly at your own risk. You accept full responsibility for any decisions or outcomes arising from your use of this website and agree to release us from any liability in connection with your use of, or reliance upon, the content or products found herein.