
|
Ane Inc. (9956.HK) DCF -Bewertung |
Fully Editable: Tailor To Your Needs In Excel Or Sheets
Professional Design: Trusted, Industry-Standard Templates
Investor-Approved Valuation Models
MAC/PC Compatible, Fully Unlocked
No Expertise Is Needed; Easy To Follow
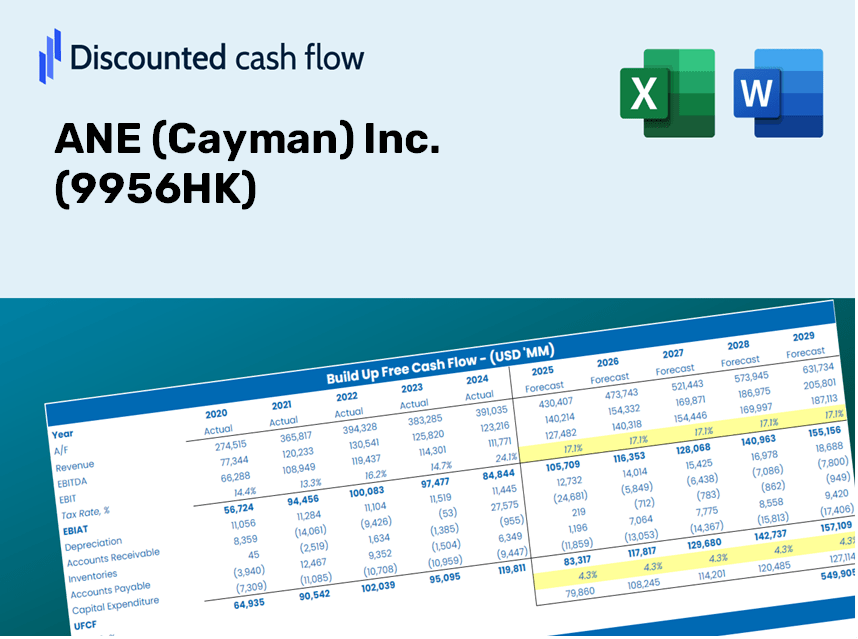
ANE (Cayman) Inc. (9956.HK) Bundle
Als Anleger oder Analyst ist dieser DCF -Taschenrechner (9956HK) Ihre wesentliche Ressource für eine genaue Bewertung. Mit realen Daten von ANE (Cayman) Inc. können Sie problemlos Prognosen anpassen und die Auswirkungen sofort beobachten.
Discounted Cash Flow (DCF) - (USD MM)
| Year | AY1 2020 |
AY2 2021 |
AY3 2022 |
AY4 2023 |
AY5 2024 |
FY1 2025 |
FY2 2026 |
FY3 2027 |
FY4 2028 |
FY5 2029 |
|---|---|---|---|---|---|---|---|---|---|---|
| Revenue | 7,749.0 | 10,554.1 | 10,214.4 | 10,851.2 | 12,666.5 | 14,438.1 | 16,457.5 | 18,759.2 | 21,383.0 | 24,373.6 |
| Revenue Growth, % | 0 | 36.2 | -3.22 | 6.23 | 16.73 | 13.99 | 13.99 | 13.99 | 13.99 | 13.99 |
| EBITDA | 1,310.7 | -1,190.5 | 1,006.9 | 1,802.1 | 1,646.1 | 1,302.2 | 1,484.3 | 1,691.9 | 1,928.5 | 2,198.3 |
| EBITDA, % | 16.91 | -11.28 | 9.86 | 16.61 | 13 | 9.02 | 9.02 | 9.02 | 9.02 | 9.02 |
| Depreciation | 659.8 | 999.5 | 1,183.0 | 1,111.9 | 481.3 | 1,259.4 | 1,435.5 | 1,636.3 | 1,865.2 | 2,126.0 |
| Depreciation, % | 8.51 | 9.47 | 11.58 | 10.25 | 3.8 | 8.72 | 8.72 | 8.72 | 8.72 | 8.72 |
| EBIT | 650.9 | -2,190.0 | -176.1 | 690.2 | 1,164.8 | 42.8 | 48.8 | 55.6 | 63.4 | 72.2 |
| EBIT, % | 8.4 | -20.75 | -1.72 | 6.36 | 9.2 | 0.2963 | 0.2963 | 0.2963 | 0.2963 | 0.2963 |
| Total Cash | 545.7 | 1,642.5 | 2,058.2 | 2,424.7 | 3,161.7 | 2,600.6 | 2,964.3 | 3,378.9 | 3,851.5 | 4,390.2 |
| Total Cash, percent | .0 | .0 | .0 | .0 | .0 | .0 | .0 | .0 | .0 | .0 |
| Account Receivables | 53.1 | 43.5 | 25.7 | 99.6 | 99.0 | 88.0 | 100.4 | 114.4 | 130.4 | 148.6 |
| Account Receivables, % | 0.68556 | 0.41262 | 0.25136 | 0.91823 | 0.78121 | 0.6098 | 0.6098 | 0.6098 | 0.6098 | 0.6098 |
| Inventories | 9.8 | 159.2 | 108.7 | 8.4 | 9.1 | 82.3 | 93.8 | 106.9 | 121.8 | 138.9 |
| Inventories, % | 0.1269 | 1.51 | 1.06 | 0.07755449 | 0.07187313 | 0.56981 | 0.56981 | 0.56981 | 0.56981 | 0.56981 |
| Accounts Payable | 814.4 | 493.3 | 334.8 | 344.2 | 388.9 | 713.4 | 813.2 | 926.9 | 1,056.5 | 1,204.3 |
| Accounts Payable, % | 10.51 | 4.67 | 3.28 | 3.17 | 3.07 | 4.94 | 4.94 | 4.94 | 4.94 | 4.94 |
| Capital Expenditure | -730.7 | -1,526.2 | -633.9 | -388.6 | -110.8 | -997.7 | -1,137.3 | -1,296.4 | -1,477.7 | -1,684.3 |
| Capital Expenditure, % | -9.43 | -14.46 | -6.21 | -3.58 | -0.87496 | -6.91 | -6.91 | -6.91 | -6.91 | -6.91 |
| Tax Rate, % | 25.69 | 25.69 | 25.69 | 25.69 | 25.69 | 25.69 | 25.69 | 25.69 | 25.69 | 25.69 |
| EBITAT | 1,713.4 | -2,071.8 | -255.8 | 490.7 | 865.5 | 37.6 | 42.9 | 48.9 | 55.8 | 63.6 |
| Depreciation | ||||||||||
| Changes in Account Receivables | ||||||||||
| Changes in Inventories | ||||||||||
| Changes in Accounts Payable | ||||||||||
| Capital Expenditure | ||||||||||
| UFCF | 2,394.0 | -3,059.5 | 203.2 | 1,249.8 | 1,280.6 | 561.5 | 417.1 | 475.4 | 541.9 | 617.7 |
| WACC, % | 9.33 | 9.3 | 9.33 | 9.18 | 9.19 | 9.26 | 9.26 | 9.26 | 9.26 | 9.26 |
| PV UFCF | ||||||||||
| SUM PV UFCF | 2,004.6 | |||||||||
| Long Term Growth Rate, % | 3.50 | |||||||||
| Free cash flow (T + 1) | 639 | |||||||||
| Terminal Value | 11,092 | |||||||||
| Present Terminal Value | 7,123 | |||||||||
| Enterprise Value | 9,127 | |||||||||
| Net Debt | -969 | |||||||||
| Equity Value | 10,097 | |||||||||
| Diluted Shares Outstanding, MM | 1,158 | |||||||||
| Equity Value Per Share | 8.72 |
What You Will Receive
- Customizable Excel Template: A fully adaptable Excel-based DCF Calculator featuring pre-loaded financial data for ANE (Cayman) Inc. (9956HK).
- Real-Time Data: Access to historical performance and forward-looking projections (highlighted in the yellow cells).
- Flexible Forecasting: Adjust key assumptions such as revenue growth, EBITDA %, and WACC.
- Instant Calculations: Immediately observe how your inputs influence the valuation of ANE (Cayman) Inc. (9956HK).
- Professional Financial Tool: Designed for investors, CFOs, consultants, and financial analysts.
- User-Friendly Layout: Organized for straightforward navigation, accompanied by clear, step-by-step guidance.
Key Features
- Customizable Financial Inputs: Adjust essential variables such as revenue growth, EBITDA margin, and capital expenditure.
- Instant DCF Valuation: Quickly computes intrinsic value, NPV, and other financial indicators.
- Industry-Leading Precision: Leverages ANE (Cayman) Inc.'s financial data for accurate valuation results.
- Streamlined Scenario Testing: Effortlessly evaluate different hypotheses and analyze results side by side.
- Efficiency Booster: Avoids the complexity of creating detailed valuation models from the ground up.
How It Works
- Step 1: Download the Excel file.
- Step 2: Review ANE (Cayman) Inc.'s pre-filled financial data and forecasts.
- Step 3: Adjust key inputs such as revenue growth, WACC, and tax rates (highlighted cells).
- Step 4: Observe the DCF model update in real-time as you modify your assumptions.
- Step 5: Evaluate the outputs and utilize the results for making investment decisions.
Why Opt for ANE (Cayman) Inc. (9956HK) Calculator?
- Reliable Data: Based on real ANE (Cayman) Inc. financials for trustworthy valuation outcomes.
- Customizable Features: Tailor key inputs such as growth rates, WACC, and tax rates to fit your forecasts.
- Efficiency Boost: Built-in calculations save you the hassle of starting from scratch.
- Professional-Quality Tool: Crafted for investors, analysts, and advisors.
- User-Friendly Interface: Easy-to-navigate design with clear, step-by-step guidance for all users.
Who Can Benefit from ANE (Cayman) Inc. (9956HK)?
- Individual Investors: Gain insights to make strategic decisions regarding ANE (Cayman) Inc. (9956HK) stock transactions.
- Financial Analysts: Enhance valuation methodologies with comprehensive financial models tailored for ANE (Cayman) Inc. (9956HK).
- Consultants: Provide clients with precise and timely valuation analyses of ANE (Cayman) Inc. (9956HK).
- Business Owners: Learn how major corporations like ANE (Cayman) Inc. (9956HK) are valued to refine your own business strategies.
- Finance Students: Explore real-world valuation techniques using data from ANE (Cayman) Inc. (9956HK) and relevant case studies.
Contents of the Template
- Historical Data: Provides past financial information and baseline forecasts for ANE (Cayman) Inc. (9956HK).
- DCF and Levered DCF Models: Comprehensive templates designed to assess the intrinsic value of ANE (Cayman) Inc. (9956HK).
- WACC Sheet: Ready-to-use calculations for the Weighted Average Cost of Capital.
- Editable Inputs: Customize essential drivers such as growth rates, EBITDA percentages, and CAPEX assumptions.
- Quarterly and Annual Financial Statements: A thorough analysis of ANE (Cayman) Inc. (9956HK) financial performance.
- Interactive Dashboard: Dynamic visualization of valuation outcomes and projections.
Disclaimer
All information, articles, and product details provided on this website are for general informational and educational purposes only. We do not claim any ownership over, nor do we intend to infringe upon, any trademarks, copyrights, logos, brand names, or other intellectual property mentioned or depicted on this site. Such intellectual property remains the property of its respective owners, and any references here are made solely for identification or informational purposes, without implying any affiliation, endorsement, or partnership.
We make no representations or warranties, express or implied, regarding the accuracy, completeness, or suitability of any content or products presented. Nothing on this website should be construed as legal, tax, investment, financial, medical, or other professional advice. In addition, no part of this site—including articles or product references—constitutes a solicitation, recommendation, endorsement, advertisement, or offer to buy or sell any securities, franchises, or other financial instruments, particularly in jurisdictions where such activity would be unlawful.
All content is of a general nature and may not address the specific circumstances of any individual or entity. It is not a substitute for professional advice or services. Any actions you take based on the information provided here are strictly at your own risk. You accept full responsibility for any decisions or outcomes arising from your use of this website and agree to release us from any liability in connection with your use of, or reliance upon, the content or products found herein.