
|
Innoyare Pharma Limited (9969.HK) DCF -Bewertung |
Fully Editable: Tailor To Your Needs In Excel Or Sheets
Professional Design: Trusted, Industry-Standard Templates
Investor-Approved Valuation Models
MAC/PC Compatible, Fully Unlocked
No Expertise Is Needed; Easy To Follow
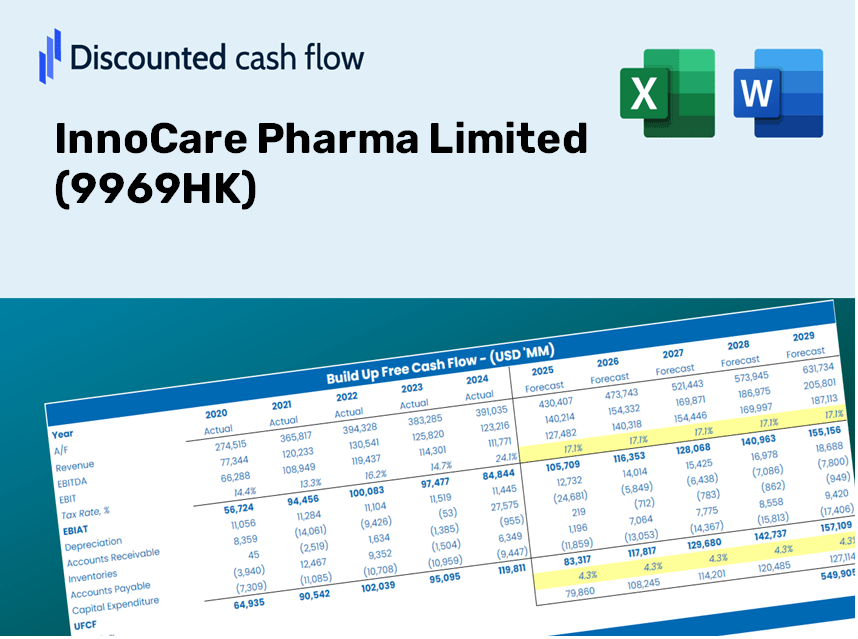
InnoCare Pharma Limited (9969.HK) Bundle
Maximieren Sie die Effizienz und verbessern Sie die Präzision mit unserem DCF -Taschenrechner (9969HK)! Mithilfe realer Daten von Innoyare Pharma Limited und anpassbaren Annahmen können Sie Innocare Pharma wie einen erfahrenen Investor prognostizieren, analysieren und bewerten.
Discounted Cash Flow (DCF) - (USD MM)
| Year | AY1 2020 |
AY2 2021 |
AY3 2022 |
AY4 2023 |
AY5 2024 |
FY1 2025 |
FY2 2026 |
FY3 2027 |
FY4 2028 |
FY5 2029 |
|---|---|---|---|---|---|---|---|---|---|---|
| Revenue | 1.5 | 1,139.6 | 683.3 | 806.9 | 1,102.9 | 1,419.3 | 1,826.3 | 2,350.2 | 3,024.3 | 3,891.7 |
| Revenue Growth, % | 0 | 76368.7 | -40.04 | 18.09 | 36.68 | 28.68 | 28.68 | 28.68 | 28.68 | 28.68 |
| EBITDA | -608.5 | 17.7 | -883.1 | -564.4 | -506.4 | -892.1 | -1,148.0 | -1,477.3 | -1,901.1 | -2,446.4 |
| EBITDA, % | -40829.77 | 1.56 | -129.24 | -69.94 | -45.91 | -62.86 | -62.86 | -62.86 | -62.86 | -62.86 |
| Depreciation | 2.3 | 36.8 | 74.7 | 101.2 | 63.4 | 376.0 | 483.8 | 622.6 | 801.2 | 1,031.0 |
| Depreciation, % | 151.61 | 3.23 | 10.94 | 12.54 | 5.74 | 26.49 | 26.49 | 26.49 | 26.49 | 26.49 |
| EBIT | -610.7 | -19.1 | -957.9 | -665.6 | -569.8 | -953.2 | -1,226.6 | -1,578.5 | -2,031.2 | -2,613.8 |
| EBIT, % | -40981.38 | -1.68 | -140.18 | -82.48 | -51.66 | -67.16 | -67.16 | -67.16 | -67.16 | -67.16 |
| Total Cash | 4,337.2 | 6,824.0 | 9,845.5 | 8,986.1 | 6,798.8 | 1,419.3 | 1,826.3 | 2,350.2 | 3,024.3 | 3,891.7 |
| Total Cash, percent | .3 | .0 | .0 | .0 | .0 | .0 | .0 | .0 | .0 | .0 |
| Account Receivables | 33.4 | 98.5 | 193.9 | .0 | 383.5 | 487.6 | 627.5 | 807.5 | 1,039.1 | 1,337.2 |
| Account Receivables, % | 2238.34 | 8.65 | 28.38 | 0.000021799856 | 34.77 | 34.36 | 34.36 | 34.36 | 34.36 | 34.36 |
| Inventories | 2.1 | 10.8 | 71.4 | 130.1 | 104.4 | 388.8 | 500.4 | 643.9 | 828.6 | 1,066.3 |
| Inventories, % | 137.68 | 0.95088 | 10.44 | 16.13 | 9.47 | 27.4 | 27.4 | 27.4 | 27.4 | 27.4 |
| Accounts Payable | 6.0 | 92.4 | 129.6 | 147.4 | 140.2 | 448.6 | 577.3 | 742.9 | 956.0 | 1,230.2 |
| Accounts Payable, % | 404.69 | 8.11 | 18.96 | 18.27 | 12.72 | 31.61 | 31.61 | 31.61 | 31.61 | 31.61 |
| Capital Expenditure | -274.5 | -182.5 | -404.6 | -278.2 | -85.5 | -617.3 | -794.3 | -1,022.2 | -1,315.3 | -1,692.6 |
| Capital Expenditure, % | -18421.26 | -16.02 | -59.21 | -34.48 | -7.75 | -43.49 | -43.49 | -43.49 | -43.49 | -43.49 |
| Tax Rate, % | 2.64 | 2.64 | 2.64 | 2.64 | 2.64 | 2.64 | 2.64 | 2.64 | 2.64 | 2.64 |
| EBITAT | -610.0 | -61.3 | -950.2 | -652.2 | -554.7 | -942.6 | -1,213.0 | -1,560.9 | -2,008.6 | -2,584.7 |
| Depreciation | ||||||||||
| Changes in Account Receivables | ||||||||||
| Changes in Inventories | ||||||||||
| Changes in Accounts Payable | ||||||||||
| Capital Expenditure | ||||||||||
| UFCF | -911.7 | -194.5 | -1,398.8 | -676.3 | -941.8 | -1,264.1 | -1,646.2 | -2,118.4 | -2,726.0 | -3,507.9 |
| WACC, % | 7 | 7 | 7 | 7 | 6.99 | 7 | 7 | 7 | 7 | 7 |
| PV UFCF | ||||||||||
| SUM PV UFCF | -8,929.8 | |||||||||
| Long Term Growth Rate, % | 2.00 | |||||||||
| Free cash flow (T + 1) | -3,578 | |||||||||
| Terminal Value | -71,595 | |||||||||
| Present Terminal Value | -51,052 | |||||||||
| Enterprise Value | -59,982 | |||||||||
| Net Debt | -5,409 | |||||||||
| Equity Value | -54,573 | |||||||||
| Diluted Shares Outstanding, MM | 1,691 | |||||||||
| Equity Value Per Share | -32.28 |
What You Will Receive
- Adjustable Forecast Inputs: Effortlessly modify assumptions (growth %, margins, WACC) to explore various scenarios.
- Real-World Financial Data: InnoCare Pharma Limited’s (9969HK) financial figures pre-loaded to facilitate your analysis.
- Automated DCF Outputs: The template computes Net Present Value (NPV) and intrinsic value for you.
- Customizable and Professional Design: A sleek Excel model tailored to meet your valuation requirements.
- Designed for Analysts and Investors: Perfect for assessing projections, confirming strategies, and optimizing efficiency.
Key Features
- Customizable Forecast Inputs: Adjust essential parameters such as revenue growth, EBITDA margin, and capital investments.
- Instant DCF Valuation: Automatically computes intrinsic value, NPV, and additional financial metrics.
- High-Precision Accuracy: Leverages InnoCare Pharma Limited’s (9969HK) actual financial data for accurate valuation results.
- Simplified Scenario Analysis: Effortlessly explore various assumptions and evaluate different outcomes.
- Efficiency Booster: Remove the hassle of constructing intricate valuation models from the ground up.
How It Works
- 1. Access the Template: Download and open the Excel file featuring InnoCare Pharma Limited's (9969HK) preloaded data.
- 2. Adjust Assumptions: Modify essential inputs such as growth projections, WACC, and capital expenditures.
- 3. See Results Immediately: The DCF model automatically calculates intrinsic value and NPV in real-time.
- 4. Explore Scenarios: Analyze various forecasts to evaluate different valuation outcomes.
- 5. Present with Assurance: Deliver professional valuation insights to inform your strategic decisions.
Why Opt for InnoCare Pharma Limited (9969HK) Calculator?
- Time Efficient: Skip the hassle of building a DCF model from scratch – it’s ready for immediate use.
- Enhanced Accuracy: Dependable financial data and formulas minimize valuation errors.
- Completely Customizable: Adjust the model to align with your specific assumptions and forecasts.
- Simple to Understand: Intuitive charts and outputs facilitate straightforward result analysis.
- Endorsed by Professionals: Crafted for experts who prioritize both precision and ease of use.
Who Should Use This Product?
- Professional Investors: Develop comprehensive and accurate valuation models for portfolio assessments of InnoCare Pharma Limited (9969HK).
- Corporate Finance Teams: Evaluate valuation scenarios to inform strategic decisions within the organization.
- Consultants and Advisors: Deliver precise valuation insights for clients considering investments in InnoCare Pharma Limited (9969HK).
- Students and Educators: Leverage real-world data to enhance learning and practice in financial modeling.
- Healthcare Enthusiasts: Gain insights into how pharmaceutical companies like InnoCare Pharma Limited (9969HK) are valued in the market.
Contents of the Template
- Preloaded InnoCare Pharma Data: Historical and projected financial metrics, including revenue, EBIT, and capital expenditures.
- DCF and WACC Models: Advanced spreadsheets designed for calculating intrinsic value and Weighted Average Cost of Capital.
- Editable Inputs: Yellow-highlighted fields for customizing revenue growth rates, tax rates, and discount rates.
- Financial Statements: Detailed annual and quarterly financial reports for in-depth analysis.
- Key Ratios: Profitability, leverage, and efficiency ratios to assess performance.
- Dashboard and Charts: Visual representations of valuation results and assumptions.
Disclaimer
All information, articles, and product details provided on this website are for general informational and educational purposes only. We do not claim any ownership over, nor do we intend to infringe upon, any trademarks, copyrights, logos, brand names, or other intellectual property mentioned or depicted on this site. Such intellectual property remains the property of its respective owners, and any references here are made solely for identification or informational purposes, without implying any affiliation, endorsement, or partnership.
We make no representations or warranties, express or implied, regarding the accuracy, completeness, or suitability of any content or products presented. Nothing on this website should be construed as legal, tax, investment, financial, medical, or other professional advice. In addition, no part of this site—including articles or product references—constitutes a solicitation, recommendation, endorsement, advertisement, or offer to buy or sell any securities, franchises, or other financial instruments, particularly in jurisdictions where such activity would be unlawful.
All content is of a general nature and may not address the specific circumstances of any individual or entity. It is not a substitute for professional advice or services. Any actions you take based on the information provided here are strictly at your own risk. You accept full responsibility for any decisions or outcomes arising from your use of this website and agree to release us from any liability in connection with your use of, or reliance upon, the content or products found herein.