
|
Acumen Pharmaceuticals, Inc. (ABOS) DCF -Bewertung |
Fully Editable: Tailor To Your Needs In Excel Or Sheets
Professional Design: Trusted, Industry-Standard Templates
Investor-Approved Valuation Models
MAC/PC Compatible, Fully Unlocked
No Expertise Is Needed; Easy To Follow
Acumen Pharmaceuticals, Inc. (ABOS) Bundle
Gewinnen Sie einen Einblick in Ihre Acumen Pharmaceuticals, Inc. (ABOS) Bewertungsanalyse mit unserem ausgefeilten DCF -Taschenrechner! Diese Excel -Vorlage mit realen (ABOS-) Daten vorinstalliert und ermöglicht es Ihnen, die Prognosen und Annahmen anzupassen, um den inneren Wert von Acumen Pharmaceuticals, Inc. (ABOS) genau zu bestimmen.
What You Will Receive
- Customizable Excel Template: A fully adjustable Excel-based DCF Calculator featuring pre-filled real Acumen Pharmaceuticals (ABOS) financials.
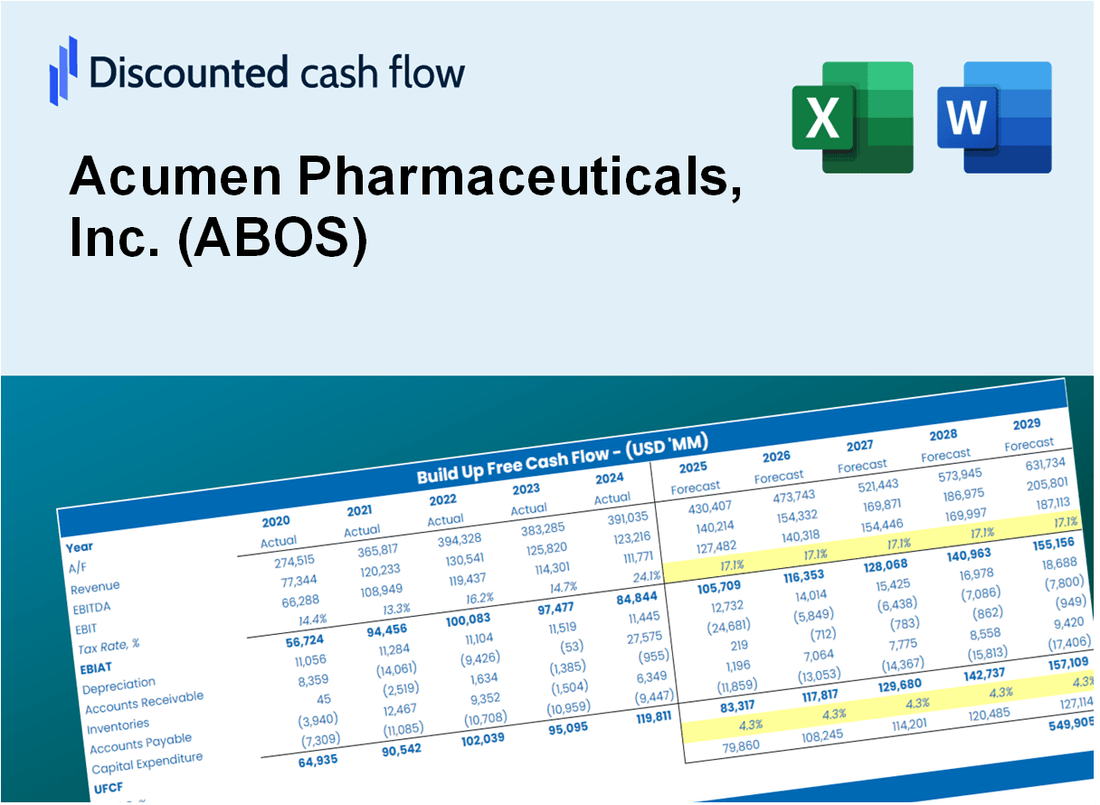
- Authentic Data: Historical data and projected estimates (highlighted in the yellow cells).
- Flexible Forecasting: Adjust forecast assumptions such as revenue growth, EBITDA %, and WACC.
- Instant Calculations: Quickly observe the effects of your inputs on Acumen Pharmaceuticals' valuation.
- Professional Resource: Designed for investors, CFOs, consultants, and financial analysts.
- Intuitive Design: Organized for clarity and user-friendliness, complete with step-by-step guidance.
Key Features
- Customizable Research Parameters: Adjust key factors such as clinical trial timelines, revenue forecasts, and research expenditures.
- Instant Valuation Metrics: Provides real-time calculations for intrinsic value, NPV, and additional financial outputs.
- High-Precision Analysis: Leverages Acumen Pharmaceuticals’ (ABOS) actual financial data for accurate valuation results.
- Effortless Scenario Testing: Easily evaluate various assumptions and analyze different outcomes.
- Efficiency Booster: Streamlines the valuation process, eliminating the need for complex model construction from the ground up.
How It Works
- Step 1: Download the prebuilt Excel template with Acumen Pharmaceuticals' data included.
- Step 2: Explore the pre-filled sheets and familiarize yourself with the key metrics.
- Step 3: Update forecasts and assumptions in the editable yellow cells (WACC, growth, margins).
- Step 4: Instantly view recalculated results, including Acumen Pharmaceuticals' intrinsic value.
- Step 5: Make informed investment decisions or generate reports using the outputs.
Why Choose This Calculator for Acumen Pharmaceuticals, Inc. (ABOS)?
- Accurate Data: Leverage real Acumen Pharmaceuticals financials for dependable valuation outcomes.
- Customizable: Tailor essential parameters like growth rates, WACC, and tax rates to fit your forecasts.
- Time-Saving: Utilize pre-built calculations to avoid starting from scratch.
- Professional-Grade Tool: Crafted for investors, analysts, and consultants in the pharmaceutical sector.
- User-Friendly: Easy-to-navigate layout and clear instructions ensure accessibility for all users.
Who Should Use This Product?
- Investors: Gain a precise understanding of Acumen Pharmaceuticals’ fair value prior to making investment choices.
- CFOs: Utilize a professional-grade DCF model for comprehensive financial reporting and analysis.
- Consultants: Efficiently customize the template for client valuation reports.
- Entrepreneurs: Discover insights into financial modeling practices employed by leading pharmaceutical companies.
- Educators: Employ it as a teaching resource to illustrate valuation techniques.
What the Template Contains
- Preloaded ABOS Data: Historical and projected financial data, including revenue, EBIT, and capital expenditures.
- DCF and WACC Models: Professional-grade sheets for calculating intrinsic value and Weighted Average Cost of Capital.
- Editable Inputs: Yellow-highlighted cells for adjusting revenue growth, tax rates, and discount rates.
- Financial Statements: Comprehensive annual and quarterly financials for deeper analysis.
- Key Ratios: Profitability, leverage, and efficiency ratios to evaluate performance.
- Dashboard and Charts: Visual summaries of valuation outcomes and assumptions.
Disclaimer
All information, articles, and product details provided on this website are for general informational and educational purposes only. We do not claim any ownership over, nor do we intend to infringe upon, any trademarks, copyrights, logos, brand names, or other intellectual property mentioned or depicted on this site. Such intellectual property remains the property of its respective owners, and any references here are made solely for identification or informational purposes, without implying any affiliation, endorsement, or partnership.
We make no representations or warranties, express or implied, regarding the accuracy, completeness, or suitability of any content or products presented. Nothing on this website should be construed as legal, tax, investment, financial, medical, or other professional advice. In addition, no part of this site—including articles or product references—constitutes a solicitation, recommendation, endorsement, advertisement, or offer to buy or sell any securities, franchises, or other financial instruments, particularly in jurisdictions where such activity would be unlawful.
All content is of a general nature and may not address the specific circumstances of any individual or entity. It is not a substitute for professional advice or services. Any actions you take based on the information provided here are strictly at your own risk. You accept full responsibility for any decisions or outcomes arising from your use of this website and agree to release us from any liability in connection with your use of, or reliance upon, the content or products found herein.