
|
Abbott Laboratories (ABT) DCF -Bewertung |
Fully Editable: Tailor To Your Needs In Excel Or Sheets
Professional Design: Trusted, Industry-Standard Templates
Investor-Approved Valuation Models
MAC/PC Compatible, Fully Unlocked
No Expertise Is Needed; Easy To Follow
Abbott Laboratories (ABT) Bundle
Bewerten Sie die finanziellen Aussichten von Abbott Laboratories wie ein Fachmann! Dieser ABT-DCF-Taschenrechner bietet vorgefüllte Finanzdaten sowie die Flexibilität, das Umsatzwachstum, WACC, Margen und andere wesentliche Annahmen zu ändern, um sich an Ihren Projektionen anzupassen.
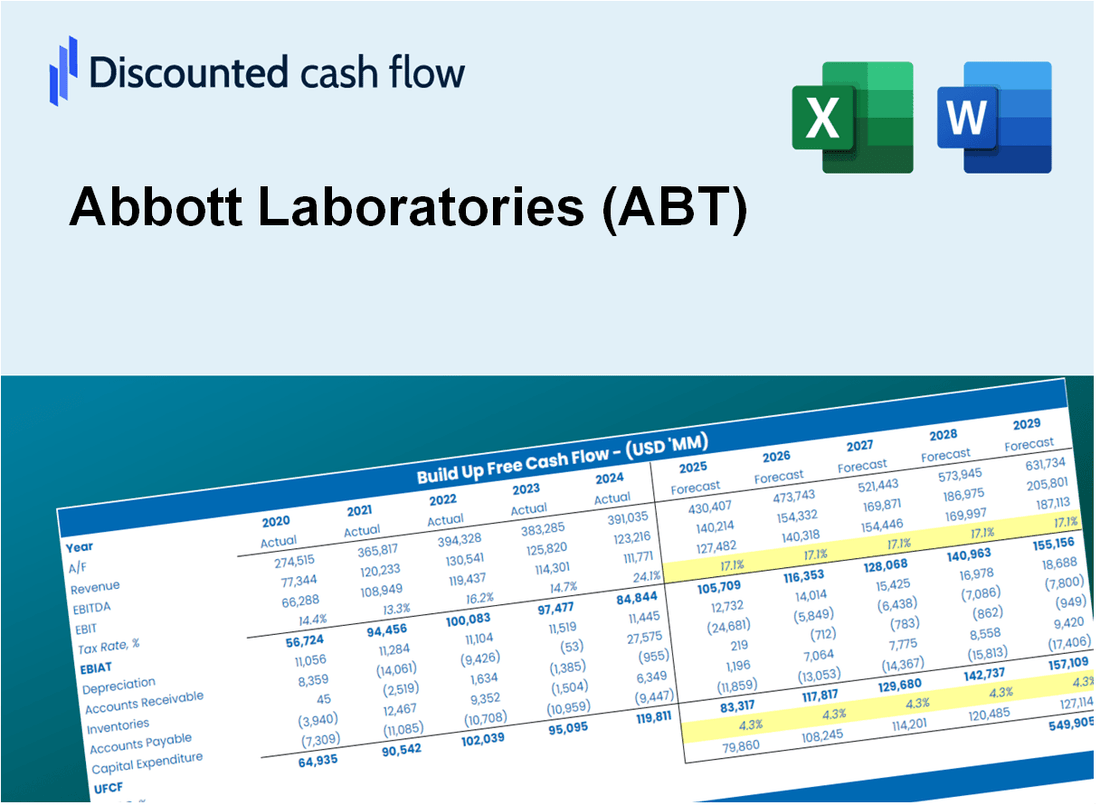
Discounted Cash Flow (DCF) - (USD MM)
| Year | AY1 2020 |
AY2 2021 |
AY3 2022 |
AY4 2023 |
AY5 2024 |
FY1 2025 |
FY2 2026 |
FY3 2027 |
FY4 2028 |
FY5 2029 |
|---|---|---|---|---|---|---|---|---|---|---|
| Revenue | 34,608.0 | 43,075.0 | 43,653.0 | 40,109.0 | 41,950.0 | 44,286.5 | 46,753.1 | 49,357.1 | 52,106.1 | 55,008.3 |
| Revenue Growth, % | 0 | 24.47 | 1.34 | -8.12 | 4.59 | 5.57 | 5.57 | 5.57 | 5.57 | 5.57 |
| EBITDA | 9,003.0 | 12,159.0 | 11,888.0 | 10,605.0 | 10,834.0 | 11,845.8 | 12,505.6 | 13,202.1 | 13,937.5 | 14,713.7 |
| EBITDA, % | 26.01 | 28.23 | 27.23 | 26.44 | 25.83 | 26.75 | 26.75 | 26.75 | 26.75 | 26.75 |
| Depreciation | 3,327.0 | 3,538.0 | 3,267.0 | 3,243.0 | 3,218.0 | 3,637.5 | 3,840.1 | 4,053.9 | 4,279.7 | 4,518.1 |
| Depreciation, % | 9.61 | 8.21 | 7.48 | 8.09 | 7.67 | 8.21 | 8.21 | 8.21 | 8.21 | 8.21 |
| EBIT | 5,676.0 | 8,621.0 | 8,621.0 | 7,362.0 | 7,616.0 | 8,208.4 | 8,665.6 | 9,148.2 | 9,657.7 | 10,195.6 |
| EBIT, % | 16.4 | 20.01 | 19.75 | 18.35 | 18.15 | 18.53 | 18.53 | 18.53 | 18.53 | 18.53 |
| Total Cash | 7,148.0 | 10,249.0 | 10,170.0 | 7,279.0 | 7,967.0 | 9,289.9 | 9,807.4 | 10,353.6 | 10,930.3 | 11,539.0 |
| Total Cash, percent | .0 | .0 | .0 | .0 | .0 | .0 | .0 | .0 | .0 | .0 |
| Account Receivables | 6,414.0 | 6,487.0 | 6,218.0 | 6,565.0 | 6,925.0 | 7,149.0 | 7,547.2 | 7,967.5 | 8,411.3 | 8,879.7 |
| Account Receivables, % | 18.53 | 15.06 | 14.24 | 16.37 | 16.51 | 16.14 | 16.14 | 16.14 | 16.14 | 16.14 |
| Inventories | 5,012.0 | 5,157.0 | 6,173.0 | 6,570.0 | 6,194.0 | 6,354.3 | 6,708.2 | 7,081.9 | 7,476.3 | 7,892.7 |
| Inventories, % | 14.48 | 11.97 | 14.14 | 16.38 | 14.77 | 14.35 | 14.35 | 14.35 | 14.35 | 14.35 |
| Accounts Payable | 3,946.0 | 4,408.0 | 4,607.0 | 4,295.0 | 4,195.0 | 4,685.3 | 4,946.2 | 5,221.7 | 5,512.5 | 5,819.6 |
| Accounts Payable, % | 11.4 | 10.23 | 10.55 | 10.71 | 10 | 10.58 | 10.58 | 10.58 | 10.58 | 10.58 |
| Capital Expenditure | -2,177.0 | -1,885.0 | -1,777.0 | -2,202.0 | -2,207.0 | -2,257.6 | -2,383.3 | -2,516.1 | -2,656.2 | -2,804.1 |
| Capital Expenditure, % | -6.29 | -4.38 | -4.07 | -5.49 | -5.26 | -5.1 | -5.1 | -5.1 | -5.1 | -5.1 |
| Tax Rate, % | -91.1 | -91.1 | -91.1 | -91.1 | -91.1 | -91.1 | -91.1 | -91.1 | -91.1 | -91.1 |
| EBITAT | 5,135.6 | 7,424.1 | 7,195.9 | 6,322.4 | 14,554.3 | 7,321.0 | 7,728.7 | 8,159.2 | 8,613.6 | 9,093.4 |
| Depreciation | ||||||||||
| Changes in Account Receivables | ||||||||||
| Changes in Inventories | ||||||||||
| Changes in Accounts Payable | ||||||||||
| Capital Expenditure | ||||||||||
| UFCF | -1,194.4 | 9,321.1 | 8,137.9 | 6,307.4 | 15,481.3 | 8,806.8 | 8,694.3 | 9,178.6 | 9,689.8 | 10,229.5 |
| WACC, % | 6.91 | 6.9 | 6.89 | 6.9 | 6.93 | 6.91 | 6.91 | 6.91 | 6.91 | 6.91 |
| PV UFCF | ||||||||||
| SUM PV UFCF | 38,100.3 | |||||||||
| Long Term Growth Rate, % | 4.00 | |||||||||
| Free cash flow (T + 1) | 10,639 | |||||||||
| Terminal Value | 365,956 | |||||||||
| Present Terminal Value | 262,057 | |||||||||
| Enterprise Value | 300,158 | |||||||||
| Net Debt | 7,659 | |||||||||
| Equity Value | 292,499 | |||||||||
| Diluted Shares Outstanding, MM | 1,748 | |||||||||
| Equity Value Per Share | 167.33 |
What You Will Get
- Editable Forecast Inputs: Easily modify assumptions (growth %, margins, WACC) to explore various scenarios.
- Real-World Data: Abbott Laboratories’ (ABT) financial data pre-filled to accelerate your analysis.
- Automatic DCF Outputs: The template computes Net Present Value (NPV) and intrinsic value automatically.
- Customizable and Professional: A refined Excel model that adjusts to your valuation requirements.
- Built for Analysts and Investors: Perfect for testing projections, validating strategies, and enhancing efficiency.
Key Features
- Customizable Financial Inputs: Adjust key metrics such as revenue growth, operating margin, and research & development expenses.
- Instant DCF Valuation: Quickly computes intrinsic value, net present value, and other financial outputs.
- High-Precision Analytics: Leverages Abbott's actual financial data for accurate valuation results.
- Effortless Scenario Testing: Easily evaluate various assumptions and analyze different outcomes.
- Efficiency Booster: Streamline the valuation process without the hassle of creating complex models from the ground up.
How It Works
- 1. Access the Template: Download and open the Excel file containing Abbott Laboratories' (ABT) preloaded data.
- 2. Modify Assumptions: Adjust key inputs such as growth rates, WACC, and capital expenditures.
- 3. See Results Immediately: The DCF model automatically calculates intrinsic value and NPV.
- 4. Evaluate Scenarios: Analyze various forecasts to understand different valuation outcomes.
- 5. Present with Assurance: Deliver professional valuation insights to back your decisions.
Why Choose Abbott Laboratories (ABT) Stock Analysis?
- Save Time: No need to analyze financials from scratch – our tools are ready to use.
- Enhance Accuracy: Access to reliable data and analytical models minimizes valuation errors.
- Fully Customizable: Adjust the analysis to match your investment assumptions and forecasts.
- Easy to Understand: Intuitive charts and summaries simplify the interpretation of results.
- Endorsed by Professionals: Crafted for investors who prioritize accuracy and user-friendliness.
Who Should Use Abbott Laboratories (ABT)?
- Investors: Gain insights for informed investment decisions with a comprehensive analysis of Abbott Laboratories (ABT).
- Financial Analysts: Streamline your evaluations using a tailored financial model specific to Abbott Laboratories (ABT).
- Consultants: Easily modify the analysis for client briefings or strategic recommendations focused on Abbott Laboratories (ABT).
- Healthcare Enthusiasts: Enhance your knowledge of the healthcare sector through detailed insights into Abbott Laboratories (ABT).
- Educators and Students: Utilize this resource as a hands-on learning tool in healthcare finance courses.
What the Template Contains
- Preloaded ABT Data: Historical and projected financial data, including revenue, EBIT, and capital expenditures.
- DCF and WACC Models: Professional-grade sheets for calculating intrinsic value and Weighted Average Cost of Capital.
- Editable Inputs: Yellow-highlighted cells for adjusting revenue growth, tax rates, and discount rates.
- Financial Statements: Comprehensive annual and quarterly financials for deeper analysis.
- Key Ratios: Profitability, leverage, and efficiency ratios to evaluate performance.
- Dashboard and Charts: Visual summaries of valuation outcomes and assumptions.
Disclaimer
All information, articles, and product details provided on this website are for general informational and educational purposes only. We do not claim any ownership over, nor do we intend to infringe upon, any trademarks, copyrights, logos, brand names, or other intellectual property mentioned or depicted on this site. Such intellectual property remains the property of its respective owners, and any references here are made solely for identification or informational purposes, without implying any affiliation, endorsement, or partnership.
We make no representations or warranties, express or implied, regarding the accuracy, completeness, or suitability of any content or products presented. Nothing on this website should be construed as legal, tax, investment, financial, medical, or other professional advice. In addition, no part of this site—including articles or product references—constitutes a solicitation, recommendation, endorsement, advertisement, or offer to buy or sell any securities, franchises, or other financial instruments, particularly in jurisdictions where such activity would be unlawful.
All content is of a general nature and may not address the specific circumstances of any individual or entity. It is not a substitute for professional advice or services. Any actions you take based on the information provided here are strictly at your own risk. You accept full responsibility for any decisions or outcomes arising from your use of this website and agree to release us from any liability in connection with your use of, or reliance upon, the content or products found herein.