
|
Crédit Agricole S.A. (ACA.PA) DCF -Bewertung |
Fully Editable: Tailor To Your Needs In Excel Or Sheets
Professional Design: Trusted, Industry-Standard Templates
Investor-Approved Valuation Models
MAC/PC Compatible, Fully Unlocked
No Expertise Is Needed; Easy To Follow
Crédit Agricole S.A. (ACA.PA) Bundle
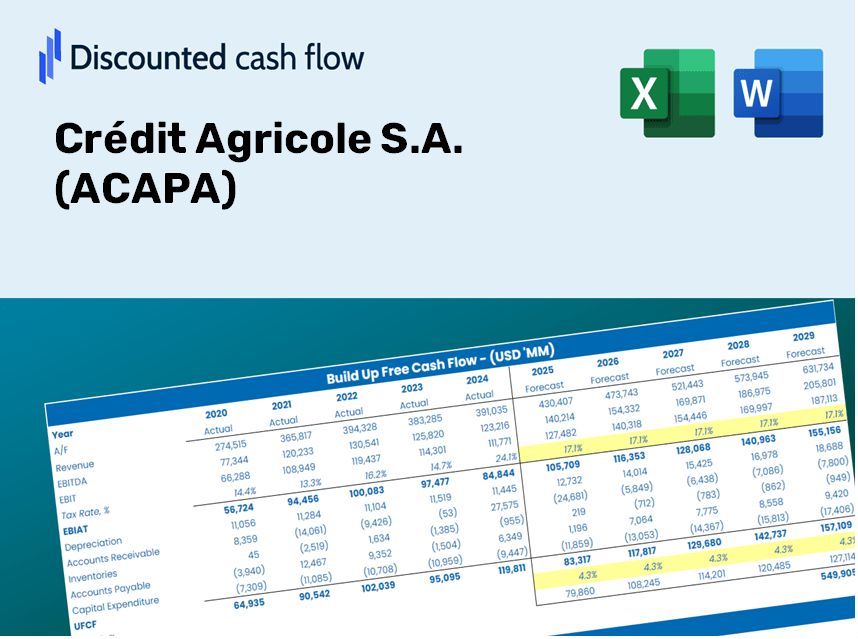
Als Anleger oder Analyst dient der DCF -Taschenrechner von Crédit Agricole S.A. (ACAPA) als wesentliches Instrument für eine genaue Bewertung. Ausgestattet mit echten Daten von Crédit Agricole S.A. können Sie Prognosen anpassen und die Auswirkungen sofort beobachten.
Discounted Cash Flow (DCF) - (USD MM)
| Year | AY1 2020 |
AY2 2021 |
AY3 2022 |
AY4 2023 |
AY5 2024 |
FY1 2025 |
FY2 2026 |
FY3 2027 |
FY4 2028 |
FY5 2029 |
|---|---|---|---|---|---|---|---|---|---|---|
| Revenue | 18,061.0 | 21,397.0 | 21,955.0 | 23,454.0 | 25,328.0 | 27,601.0 | 30,077.9 | 32,777.1 | 35,718.5 | 38,923.9 |
| Revenue Growth, % | 0 | 18.47 | 2.61 | 6.83 | 7.99 | 8.97 | 8.97 | 8.97 | 8.97 | 8.97 |
| EBITDA | 5,318.0 | 8,878.0 | 8,975.0 | 10,504.0 | 11,871.0 | 11,231.9 | 12,239.9 | 13,338.3 | 14,535.3 | 15,839.7 |
| EBITDA, % | 29.44 | 41.49 | 40.88 | 44.79 | 46.87 | 40.69 | 40.69 | 40.69 | 40.69 | 40.69 |
| Depreciation | 1,142.0 | 1,153.0 | 1,104.0 | 1,155.0 | 1,245.0 | 1,467.3 | 1,598.9 | 1,742.4 | 1,898.8 | 2,069.2 |
| Depreciation, % | 6.32 | 5.39 | 5.03 | 4.92 | 4.92 | 5.32 | 5.32 | 5.32 | 5.32 | 5.32 |
| EBIT | 4,176.0 | 7,725.0 | 7,871.0 | 9,349.0 | 10,626.0 | 9,764.7 | 10,641.0 | 11,595.9 | 12,636.5 | 13,770.5 |
| EBIT, % | 23.12 | 36.1 | 35.85 | 39.86 | 41.95 | 35.38 | 35.38 | 35.38 | 35.38 | 35.38 |
| Total Cash | 698,253.0 | 640,849.0 | 654,924.0 | 598,933.0 | 581,472.0 | 27,601.0 | 30,077.9 | 32,777.1 | 35,718.5 | 38,923.9 |
| Total Cash, percent | .0 | .0 | .0 | .0 | .0 | .0 | .0 | .0 | .0 | .0 |
| Account Receivables | 56,649.0 | 70,205.0 | 104,450.0 | 96,194.0 | 95,232.0 | 27,601.0 | 30,077.9 | 32,777.1 | 35,718.5 | 38,923.9 |
| Account Receivables, % | 313.65 | 328.11 | 475.75 | 410.14 | 375.99 | 100 | 100 | 100 | 100 | 100 |
| Inventories | .0 | .0 | .0 | .0 | .0 | .0 | .0 | .0 | .0 | .0 |
| Inventories, % | 0 | 0 | 0 | 0 | 0 | 0 | 0 | 0 | 0 | 0 |
| Accounts Payable | 37,541.0 | 37,258.0 | 35,862.0 | 39,901.0 | 36,164.0 | 27,601.0 | 30,077.9 | 32,777.1 | 35,718.5 | 38,923.9 |
| Accounts Payable, % | 207.86 | 174.13 | 163.34 | 170.12 | 142.78 | 100 | 100 | 100 | 100 | 100 |
| Capital Expenditure | -748.0 | -876.0 | -1,042.0 | -885.0 | -1,070.0 | -1,158.1 | -1,262.0 | -1,375.3 | -1,498.7 | -1,633.2 |
| Capital Expenditure, % | -4.14 | -4.09 | -4.75 | -3.77 | -4.22 | -4.2 | -4.2 | -4.2 | -4.2 | -4.2 |
| Tax Rate, % | 33.31 | 33.31 | 33.31 | 33.31 | 33.31 | 33.31 | 33.31 | 33.31 | 33.31 | 33.31 |
| EBITAT | 2,450.3 | 5,587.2 | 5,568.5 | 6,217.0 | 7,087.0 | 6,541.2 | 7,128.2 | 7,767.9 | 8,465.0 | 9,224.7 |
| Depreciation | ||||||||||
| Changes in Account Receivables | ||||||||||
| Changes in Inventories | ||||||||||
| Changes in Accounts Payable | ||||||||||
| Capital Expenditure | ||||||||||
| UFCF | -16,263.7 | -7,974.8 | -30,010.5 | 18,782.0 | 4,487.0 | 65,918.4 | 7,465.1 | 8,135.0 | 8,865.1 | 9,660.6 |
| WACC, % | 9.14 | 10.97 | 10.76 | 10.19 | 10.22 | 10.26 | 10.26 | 10.26 | 10.26 | 10.26 |
| PV UFCF | ||||||||||
| SUM PV UFCF | 83,925.2 | |||||||||
| Long Term Growth Rate, % | 2.00 | |||||||||
| Free cash flow (T + 1) | 9,854 | |||||||||
| Terminal Value | 119,355 | |||||||||
| Present Terminal Value | 73,254 | |||||||||
| Enterprise Value | 157,179 | |||||||||
| Net Debt | -265,896 | |||||||||
| Equity Value | 423,075 | |||||||||
| Diluted Shares Outstanding, MM | 3,015 | |||||||||
| Equity Value Per Share | 140.32 |
What You Will Receive
- Pre-Filled Financial Model: Utilize Crédit Agricole S.A.’s (ACAPA) actual data for accurate DCF valuation.
- Comprehensive Forecast Control: Modify revenue growth, profit margins, WACC, and other essential drivers.
- Real-Time Calculations: Automatic updates provide immediate feedback as you adjust inputs.
- Professional-Grade Template: A polished Excel file crafted for high-quality valuation presentations.
- Customizable and Reusable: Designed for adaptability, allowing for ongoing use in detailed forecasting.
Key Features
- Customizable Financial Inputs: Adjust essential metrics such as loan growth, interest margins, and operating expenses.
- Instant DCF Valuation: Generate intrinsic value, NPV, and additional outputs with a single click.
- Industry-Leading Precision: Leverages Crédit Agricole’s real-time financial data for accurate valuation results.
- Simplified Scenario Analysis: Explore various assumptions and evaluate different outcomes effortlessly.
- Efficiency Boost: Remove the complexity of building intricate valuation models from the ground up.
How It Functions
- Step 1: Download the Excel spreadsheet.
- Step 2: Examine the pre-filled Crédit Agricole S.A. (ACAPA) data (both historical and projected).
- Step 3: Modify key assumptions (highlighted in yellow) based on your insights.
- Step 4: Observe the automatic recalculations for the intrinsic value of Crédit Agricole S.A. (ACAPA).
- Step 5: Utilize the results for investment strategies or reporting purposes.
Why Opt for This Calculator?
- Designed for Experts: A sophisticated tool favored by financial analysts, CFOs, and consultants.
- Comprehensive Data: Crédit Agricole S.A.’s historical and forecasted financials are preloaded for precision.
- Scenario Analysis: Easily simulate diverse forecasts and assumptions.
- Clear Results: Automatically computes intrinsic value, NPV, and essential metrics.
- User-Friendly: Step-by-step guidance ensures a smooth experience throughout the process.
Who Can Benefit from This Product?
- Individual Investors: Make well-informed choices about purchasing or selling Crédit Agricole S.A. (ACAPA) shares.
- Financial Analysts: Enhance the valuation process with comprehensive financial models at your fingertips.
- Consultants: Provide clients with accurate and timely valuation insights for Crédit Agricole S.A. (ACAPA).
- Business Owners: Gain insights into how major corporations like Crédit Agricole S.A. (ACAPA) are valued to refine your own business strategy.
- Finance Students: Master valuation techniques by applying real-world data and case studies related to Crédit Agricole S.A. (ACAPA).
Contents of the Template
- Pre-Filled DCF Model: Crédit Agricole S.A.’s (ACAPA) financial data ready for immediate application.
- WACC Calculator: Comprehensive calculations for the Weighted Average Cost of Capital.
- Financial Ratios: Analyze Crédit Agricole S.A.’s profitability, leverage, and operational efficiency.
- Editable Inputs: Modify assumptions related to growth, margins, and CAPEX to suit your specific scenarios.
- Financial Statements: Access annual and quarterly reports for in-depth analysis.
- Interactive Dashboard: Effortlessly visualize essential valuation metrics and outcomes.
Disclaimer
All information, articles, and product details provided on this website are for general informational and educational purposes only. We do not claim any ownership over, nor do we intend to infringe upon, any trademarks, copyrights, logos, brand names, or other intellectual property mentioned or depicted on this site. Such intellectual property remains the property of its respective owners, and any references here are made solely for identification or informational purposes, without implying any affiliation, endorsement, or partnership.
We make no representations or warranties, express or implied, regarding the accuracy, completeness, or suitability of any content or products presented. Nothing on this website should be construed as legal, tax, investment, financial, medical, or other professional advice. In addition, no part of this site—including articles or product references—constitutes a solicitation, recommendation, endorsement, advertisement, or offer to buy or sell any securities, franchises, or other financial instruments, particularly in jurisdictions where such activity would be unlawful.
All content is of a general nature and may not address the specific circumstances of any individual or entity. It is not a substitute for professional advice or services. Any actions you take based on the information provided here are strictly at your own risk. You accept full responsibility for any decisions or outcomes arising from your use of this website and agree to release us from any liability in connection with your use of, or reliance upon, the content or products found herein.