
|
Agenus Inc. (AGEN) DCF -Bewertung |
Fully Editable: Tailor To Your Needs In Excel Or Sheets
Professional Design: Trusted, Industry-Standard Templates
Investor-Approved Valuation Models
MAC/PC Compatible, Fully Unlocked
No Expertise Is Needed; Easy To Follow
Agenus Inc. (AGEN) Bundle
Unser (AGEN) DCF-Taschenrechner entwickelt für die Genauigkeit und ermöglicht es Ihnen, die Bewertung von Agenus Inc. mithilfe realer Finanzdaten zu bewerten, und bietet vollständige Flexibilität, um alle wesentlichen Parameter für verbesserte Projektionen zu ändern.
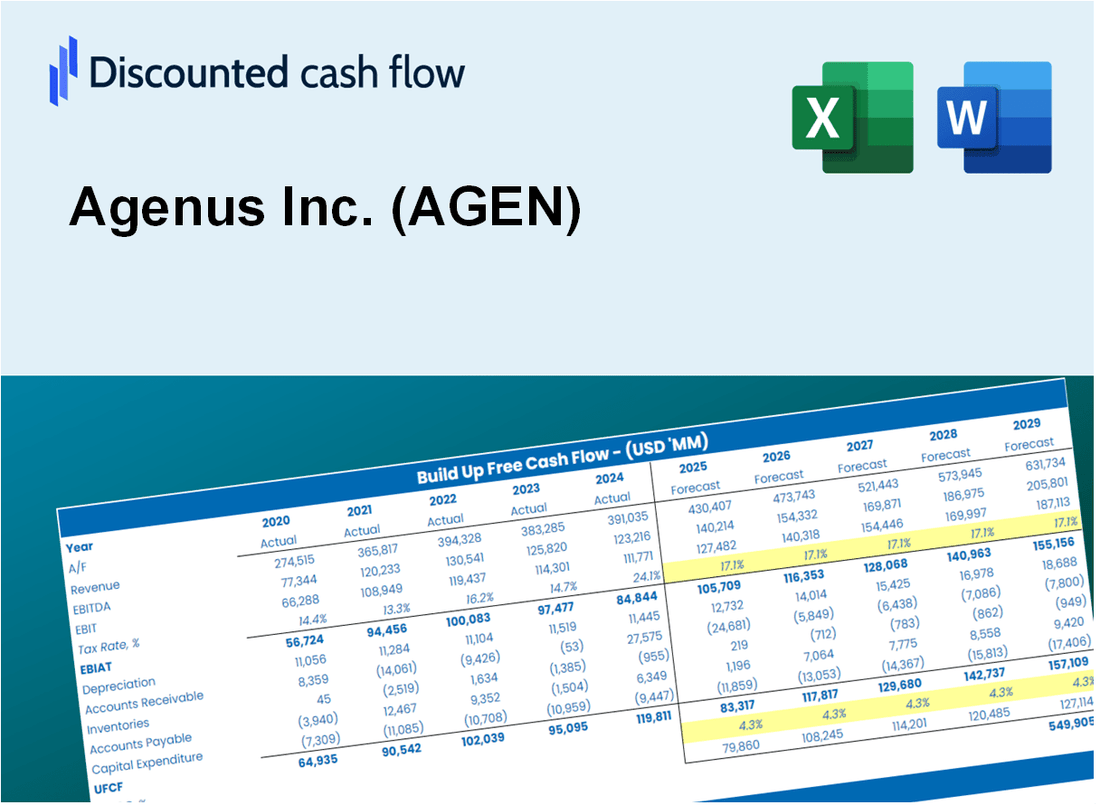
Discounted Cash Flow (DCF) - (USD MM)
| Year | AY1 2020 |
AY2 2021 |
AY3 2022 |
AY4 2023 |
AY5 2024 |
FY1 2025 |
FY2 2026 |
FY3 2027 |
FY4 2028 |
FY5 2029 |
|---|---|---|---|---|---|---|---|---|---|---|
| Revenue | 88.2 | 295.7 | 98.0 | 156.3 | 103.5 | 118.7 | 136.1 | 156.1 | 179.1 | 205.4 |
| Revenue Growth, % | 0 | 235.34 | -66.85 | 59.47 | -33.81 | 14.7 | 14.7 | 14.7 | 14.7 | 14.7 |
| EBITDA | -114.6 | 43.8 | -161.8 | -145.9 | -101.3 | -89.4 | -102.5 | -117.6 | -134.8 | -154.7 |
| EBITDA, % | -130.01 | 14.81 | -165.11 | -93.35 | -97.91 | -75.29 | -75.29 | -75.29 | -75.29 | -75.29 |
| Depreciation | 7.2 | 6.8 | 6.9 | 13.6 | 13.3 | 9.3 | 10.6 | 12.2 | 14.0 | 16.1 |
| Depreciation, % | 8.14 | 2.3 | 7.09 | 8.69 | 12.9 | 7.82 | 7.82 | 7.82 | 7.82 | 7.82 |
| EBIT | -121.8 | 37.0 | -168.8 | -159.5 | -114.6 | -92.0 | -105.5 | -121.0 | -138.8 | -159.2 |
| EBIT, % | -138.16 | 12.51 | -172.2 | -102.05 | -110.81 | -77.5 | -77.5 | -77.5 | -77.5 | -77.5 |
| Total Cash | 99.9 | 306.9 | 193.4 | 76.1 | 40.4 | 92.0 | 105.6 | 121.1 | 138.9 | 159.3 |
| Total Cash, percent | .0 | .0 | .0 | .0 | .0 | .0 | .0 | .0 | .0 | .0 |
| Account Receivables | 1.2 | 1.5 | 2.7 | 25.8 | .4 | 5.1 | 5.9 | 6.7 | 7.7 | 8.9 |
| Account Receivables, % | 1.31 | 0.51342 | 2.8 | 16.53 | 0.39338 | 4.31 | 4.31 | 4.31 | 4.31 | 4.31 |
| Inventories | .0 | 20.4 | 13.8 | .0 | .0 | 5.0 | 5.7 | 6.6 | 7.5 | 8.6 |
| Inventories, % | 0 | 6.89 | 14.11 | 0 | 0 | 4.2 | 4.2 | 4.2 | 4.2 | 4.2 |
| Accounts Payable | 17.0 | 30.5 | 40.9 | 61.4 | 61.5 | 40.4 | 46.3 | 53.1 | 60.9 | 69.9 |
| Accounts Payable, % | 19.3 | 10.31 | 41.76 | 39.31 | 59.41 | 34.02 | 34.02 | 34.02 | 34.02 | 34.02 |
| Capital Expenditure | -3.5 | -33.8 | -53.1 | -10.0 | -.6 | -18.1 | -20.8 | -23.9 | -27.4 | -31.4 |
| Capital Expenditure, % | -3.93 | -11.44 | -54.13 | -6.37 | -0.55672 | -15.28 | -15.28 | -15.28 | -15.28 | -15.28 |
| Tax Rate, % | 2.18 | 2.18 | 2.18 | 2.18 | 2.18 | 2.18 | 2.18 | 2.18 | 2.18 | 2.18 |
| EBITAT | -120.5 | 30.8 | -161.0 | -152.3 | -112.1 | -86.6 | -99.4 | -114.0 | -130.7 | -149.9 |
| Depreciation | ||||||||||
| Changes in Account Receivables | ||||||||||
| Changes in Inventories | ||||||||||
| Changes in Accounts Payable | ||||||||||
| Capital Expenditure | ||||||||||
| UFCF | -100.9 | -3.5 | -191.4 | -137.4 | -73.9 | -126.3 | -105.1 | -120.5 | -138.2 | -158.5 |
| WACC, % | 67.3 | 57.53 | 65.11 | 65.14 | 66.62 | 64.34 | 64.34 | 64.34 | 64.34 | 64.34 |
| PV UFCF | ||||||||||
| SUM PV UFCF | -175.1 | |||||||||
| Long Term Growth Rate, % | 2.00 | |||||||||
| Free cash flow (T + 1) | -162 | |||||||||
| Terminal Value | -259 | |||||||||
| Present Terminal Value | -22 | |||||||||
| Enterprise Value | -197 | |||||||||
| Net Debt | 54 | |||||||||
| Equity Value | -251 | |||||||||
| Diluted Shares Outstanding, MM | 21 | |||||||||
| Equity Value Per Share | -11.69 |
What You Will Get
- Real AGEN Financial Data: Pre-filled with Agenus Inc.’s historical and projected data for precise analysis.
- Fully Editable Template: Modify key inputs like revenue growth, WACC, and EBITDA % with ease.
- Automatic Calculations: See Agenus Inc.’s intrinsic value update instantly based on your changes.
- Professional Valuation Tool: Designed for investors, analysts, and consultants seeking accurate DCF results.
- User-Friendly Design: Simple structure and clear instructions for all experience levels.
Key Features
- Comprehensive Agenus Financials: Gain access to precise pre-loaded historical data and future forecasts.
- Adjustable Forecast Parameters: Modify yellow-highlighted cells such as WACC, growth rates, and profit margins.
- Real-Time Calculations: Automatic updates for DCF, Net Present Value (NPV), and cash flow assessments.
- Interactive Dashboard: User-friendly charts and summaries to help visualize your valuation outcomes.
- Designed for All Skill Levels: An intuitive layout tailored for investors, CFOs, and consultants alike.
How It Works
- Step 1: Download the prebuilt Excel template featuring Agenus Inc. (AGEN) data.
- Step 2: Review the pre-filled sheets to familiarize yourself with the essential metrics.
- Step 3: Modify forecasts and assumptions in the editable yellow cells (WACC, growth, margins).
- Step 4: Instantly access recalculated results, including Agenus Inc.'s (AGEN) intrinsic value.
- Step 5: Make informed investment decisions or create reports based on the outputs.
Why Choose Agenus Inc. (AGEN) Calculator?
- Save Time: Instantly access a comprehensive DCF model without starting from scratch.
- Enhance Accuracy: Utilize dependable financial data and formulas to minimize valuation errors.
- Fully Customizable: Adjust the model to align with your specific assumptions and forecasts.
- Easy to Understand: Intuitive charts and outputs simplify the analysis of results.
- Endorsed by Professionals: Crafted for experts who prioritize precision and functionality.
Who Should Use This Product?
- Finance Students: Explore advanced valuation techniques and apply them using real-time data for Agenus Inc. (AGEN).
- Academics: Integrate industry-standard models into your coursework or research focused on biotechnology.
- Investors: Validate your investment hypotheses and evaluate valuation scenarios for Agenus Inc. (AGEN).
- Analysts: Enhance your analysis process with a ready-to-use, customizable DCF model tailored for Agenus Inc. (AGEN).
- Biotech Enthusiasts: Understand the analytical methods used for evaluating companies like Agenus Inc. (AGEN).
What the Template Contains
- Pre-Filled Data: Includes Agenus Inc.'s historical financials and projections.
- Discounted Cash Flow Model: Editable DCF valuation model with automatic calculations.
- Weighted Average Cost of Capital (WACC): A dedicated sheet for calculating WACC based on custom inputs.
- Key Financial Ratios: Analyze Agenus Inc.'s profitability, efficiency, and leverage.
- Customizable Inputs: Edit revenue growth, margins, and tax rates with ease.
- Clear Dashboard: Charts and tables summarizing key valuation results.
Disclaimer
All information, articles, and product details provided on this website are for general informational and educational purposes only. We do not claim any ownership over, nor do we intend to infringe upon, any trademarks, copyrights, logos, brand names, or other intellectual property mentioned or depicted on this site. Such intellectual property remains the property of its respective owners, and any references here are made solely for identification or informational purposes, without implying any affiliation, endorsement, or partnership.
We make no representations or warranties, express or implied, regarding the accuracy, completeness, or suitability of any content or products presented. Nothing on this website should be construed as legal, tax, investment, financial, medical, or other professional advice. In addition, no part of this site—including articles or product references—constitutes a solicitation, recommendation, endorsement, advertisement, or offer to buy or sell any securities, franchises, or other financial instruments, particularly in jurisdictions where such activity would be unlawful.
All content is of a general nature and may not address the specific circumstances of any individual or entity. It is not a substitute for professional advice or services. Any actions you take based on the information provided here are strictly at your own risk. You accept full responsibility for any decisions or outcomes arising from your use of this website and agree to release us from any liability in connection with your use of, or reliance upon, the content or products found herein.