
|
AGM Group Holdings Inc. (AGMH) DCF -Bewertung |
Fully Editable: Tailor To Your Needs In Excel Or Sheets
Professional Design: Trusted, Industry-Standard Templates
Investor-Approved Valuation Models
MAC/PC Compatible, Fully Unlocked
No Expertise Is Needed; Easy To Follow
AGM Group Holdings Inc. (AGMH) Bundle
Verbessern Sie Ihre Anlagestrategien mit dem DCF -Taschenrechner von AGM Group Holdings Inc. (AGMH)! Tauchen Sie in reale AGM -Finanzdaten ein, passen Sie die Wachstumsprojektionen und -kosten an und beobachten Sie sofort, wie sich diese Veränderungen auf den den den intrinsischen Wert des AgM auswirken.
What You Will Get
- Editable Excel Template: A fully customizable Excel-based DCF Calculator featuring pre-filled real AGMH financials.
- Real-World Data: Historical data and forward-looking estimates (as indicated in the yellow cells).
- Forecast Flexibility: Adjust forecast assumptions such as revenue growth, EBITDA %, and WACC.
- Automatic Calculations: Instantly observe the effect of your inputs on AGM Group Holdings' valuation.
- Professional Tool: Designed for investors, CFOs, consultants, and financial analysts.
- User-Friendly Design: Organized for clarity and ease of use, complete with step-by-step instructions.
Key Features
- Customizable Financial Inputs: Adjust essential parameters such as revenue projections, operating margins, and capital investment.
- Instant DCF Valuation: Quickly computes intrinsic value, NPV, and other critical metrics.
- High-Precision Results: Leverages AGM Group Holdings Inc.’s (AGMH) actual financial data for accurate valuation insights.
- Streamlined Scenario Analysis: Easily evaluate various assumptions and analyze different outcomes.
- Efficiency Booster: Remove the hassle of constructing intricate valuation models from the ground up.
How It Works
- Step 1: Download the Excel file.
- Step 2: Review pre-entered AGM Group Holdings Inc. (AGMH) data (historical and projected).
- Step 3: Adjust key assumptions (yellow cells) based on your analysis.
- Step 4: View automatic recalculations for AGM Group Holdings Inc. (AGMH)’s intrinsic value.
- Step 5: Use the outputs for investment decisions or reporting.
Why Choose This Calculator for AGM Group Holdings Inc. (AGMH)?
- Accurate Data: Real AGM Group Holdings financials ensure reliable valuation results.
- Customizable: Adjust key parameters like growth rates, WACC, and tax rates to align with your projections.
- Time-Saving: Pre-built calculations save you from starting from scratch.
- Professional-Grade Tool: Tailored for investors, analysts, and consultants in the AGMH sector.
- User-Friendly: Intuitive design and step-by-step guidance make it accessible for all users.
Who Should Use AGM Group Holdings Inc. (AGMH)?
- Individual Investors: Gain insights to make informed decisions about buying or selling AGM Group Holdings Inc. (AGMH) stock.
- Financial Analysts: Enhance valuation processes with comprehensive financial models tailored for AGM Group Holdings Inc. (AGMH).
- Consultants: Provide clients with accurate and timely valuation insights regarding AGM Group Holdings Inc. (AGMH).
- Business Owners: Learn from the valuation strategies of AGM Group Holdings Inc. (AGMH) to inform your own business decisions.
- Finance Students: Explore valuation methods using real-world data and case studies related to AGM Group Holdings Inc. (AGMH).
What the Template Contains
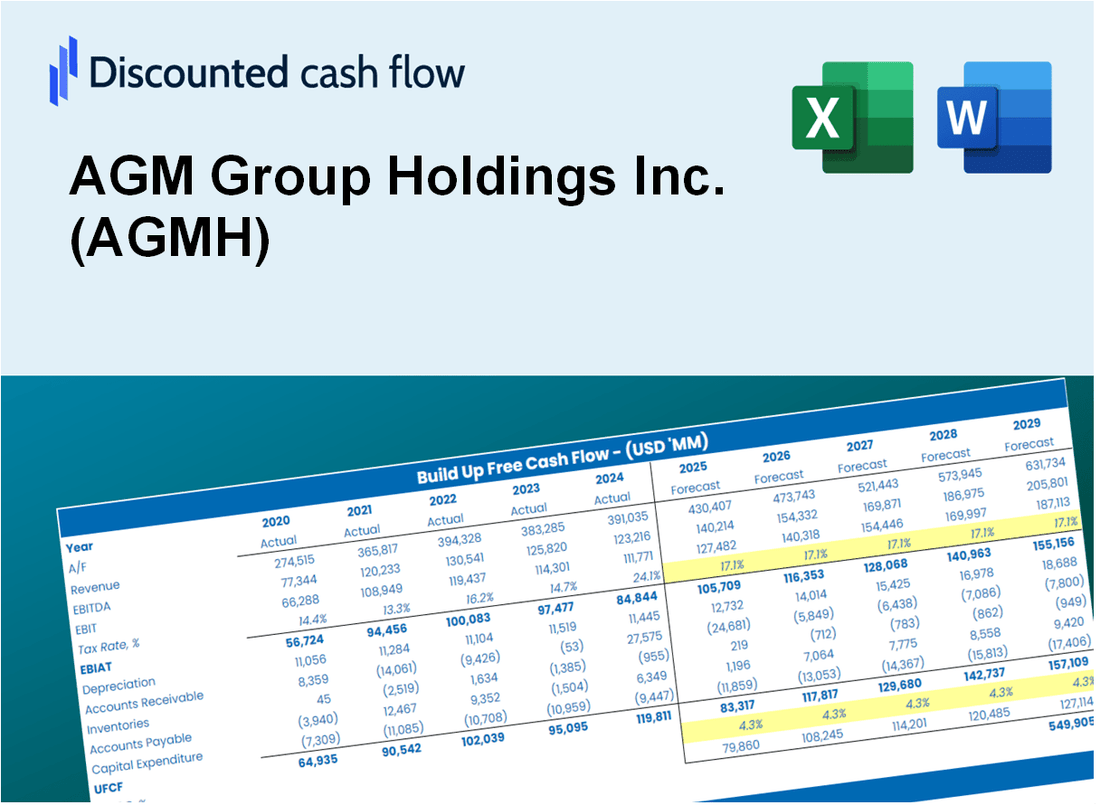
- Operating and Balance Sheet Data: Pre-filled AGM Group Holdings Inc. (AGMH) historical data and forecasts, including revenue, EBITDA, EBIT, and capital expenditures.
- WACC Calculation: A dedicated sheet for Weighted Average Cost of Capital (WACC), including parameters like Beta, risk-free rate, and share price.
- DCF Valuation (Unlevered and Levered): Editable Discounted Cash Flow models showing intrinsic value with detailed calculations.
- Financial Statements: Pre-loaded financial statements (annual and quarterly) to support analysis.
- Key Ratios: Includes profitability, leverage, and efficiency ratios for AGM Group Holdings Inc. (AGMH).
- Dashboard and Charts: Visual summary of valuation outputs and assumptions to analyze results easily.
Disclaimer
All information, articles, and product details provided on this website are for general informational and educational purposes only. We do not claim any ownership over, nor do we intend to infringe upon, any trademarks, copyrights, logos, brand names, or other intellectual property mentioned or depicted on this site. Such intellectual property remains the property of its respective owners, and any references here are made solely for identification or informational purposes, without implying any affiliation, endorsement, or partnership.
We make no representations or warranties, express or implied, regarding the accuracy, completeness, or suitability of any content or products presented. Nothing on this website should be construed as legal, tax, investment, financial, medical, or other professional advice. In addition, no part of this site—including articles or product references—constitutes a solicitation, recommendation, endorsement, advertisement, or offer to buy or sell any securities, franchises, or other financial instruments, particularly in jurisdictions where such activity would be unlawful.
All content is of a general nature and may not address the specific circumstances of any individual or entity. It is not a substitute for professional advice or services. Any actions you take based on the information provided here are strictly at your own risk. You accept full responsibility for any decisions or outcomes arising from your use of this website and agree to release us from any liability in connection with your use of, or reliance upon, the content or products found herein.