
|
Assura plc (AGR.L) DCF -Bewertung |
Fully Editable: Tailor To Your Needs In Excel Or Sheets
Professional Design: Trusted, Industry-Standard Templates
Investor-Approved Valuation Models
MAC/PC Compatible, Fully Unlocked
No Expertise Is Needed; Easy To Follow
Assura Plc (AGR.L) Bundle
Entdecken Sie den wahren Wert von Assura plc mit unserem DCF-Taschenrechner von Professional Grade! Passen Sie kritische Annahmen an, erkunden Sie verschiedene Szenarien und beurteilen Sie, wie sich Modifikationen auf die Bewertung der Assura Plc auswirken - alles innerhalb einer einzigen Excel -Vorlage.
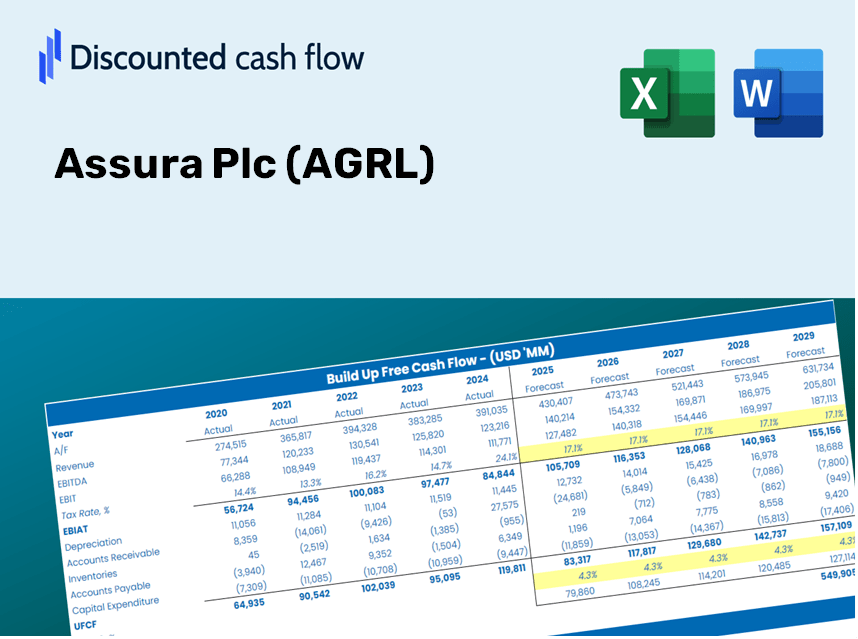
Discounted Cash Flow (DCF) - (USD MM)
| Year | AY1 2020 |
AY2 2021 |
AY3 2022 |
AY4 2023 |
AY5 2024 |
FY1 2025 |
FY2 2026 |
FY3 2027 |
FY4 2028 |
FY5 2029 |
|---|---|---|---|---|---|---|---|---|---|---|
| Revenue | 121.0 | 137.3 | 152.0 | 157.8 | 183.8 | 204.2 | 226.9 | 252.2 | 280.2 | 311.4 |
| Revenue Growth, % | 0 | 13.47 | 10.71 | 3.82 | 16.48 | 11.12 | 11.12 | 11.12 | 11.12 | 11.12 |
| EBITDA | 132.4 | 182.3 | -92.2 | -1.3 | 207.6 | 97.4 | 108.3 | 120.3 | 133.7 | 148.5 |
| EBITDA, % | 109.42 | 132.77 | -60.66 | -0.82383 | 112.95 | 47.7 | 47.7 | 47.7 | 47.7 | 47.7 |
| Depreciation | .1 | .2 | .2 | .3 | .3 | .3 | .3 | .4 | .4 | .4 |
| Depreciation, % | 0.08264463 | 0.14567 | 0.13158 | 0.19011 | 0.16322 | 0.14264 | 0.14264 | 0.14264 | 0.14264 | 0.14264 |
| EBIT | 132.3 | 182.1 | -92.4 | -1.6 | 207.3 | 97.3 | 108.1 | 120.1 | 133.5 | 148.3 |
| EBIT, % | 109.34 | 132.63 | -60.79 | -1.01 | 112.79 | 47.64 | 47.64 | 47.64 | 47.64 | 47.64 |
| Total Cash | 46.6 | 243.5 | 118.0 | 33.2 | 55.3 | 109.2 | 121.3 | 134.8 | 149.8 | 166.4 |
| Total Cash, percent | .0 | .0 | .0 | .0 | .0 | .0 | .0 | .0 | .0 | .0 |
| Account Receivables | 18.4 | 21.3 | 26.0 | 34.9 | 40.3 | 37.5 | 41.7 | 46.3 | 51.5 | 57.2 |
| Account Receivables, % | 15.21 | 15.51 | 17.11 | 22.12 | 21.93 | 18.37 | 18.37 | 18.37 | 18.37 | 18.37 |
| Inventories | 14.7 | 76.4 | .4 | .0 | .0 | 27.8 | 30.9 | 34.3 | 38.1 | 42.4 |
| Inventories, % | 12.15 | 55.64 | 0.26316 | 0 | 0 | 13.61 | 13.61 | 13.61 | 13.61 | 13.61 |
| Accounts Payable | 5.2 | 2.4 | .8 | 1.7 | 2.0 | 3.6 | 4.0 | 4.4 | 4.9 | 5.4 |
| Accounts Payable, % | 4.3 | 1.75 | 0.52632 | 1.08 | 1.09 | 1.75 | 1.75 | 1.75 | 1.75 | 1.75 |
| Capital Expenditure | -.7 | -3.5 | -15.2 | -2.8 | -18.8 | -10.3 | -11.4 | -12.7 | -14.1 | -15.6 |
| Capital Expenditure, % | -0.57851 | -2.55 | -10 | -1.77 | -10.23 | -5.03 | -5.03 | -5.03 | -5.03 | -5.03 |
| Tax Rate, % | 0 | 0 | 0 | 0 | 0 | 0 | 0 | 0 | 0 | 0 |
| EBITAT | 132.3 | 182.2 | -92.9 | -1.6 | 207.3 | 97.3 | 108.1 | 120.1 | 133.5 | 148.3 |
| Depreciation | ||||||||||
| Changes in Account Receivables | ||||||||||
| Changes in Inventories | ||||||||||
| Changes in Accounts Payable | ||||||||||
| Capital Expenditure | ||||||||||
| UFCF | 103.8 | 111.5 | -38.2 | -11.7 | 183.7 | 63.9 | 90.2 | 100.2 | 111.3 | 123.7 |
| WACC, % | 4.98 | 4.98 | 4.98 | 4.98 | 4.98 | 4.98 | 4.98 | 4.98 | 4.98 | 4.98 |
| PV UFCF | ||||||||||
| SUM PV UFCF | 417.9 | |||||||||
| Long Term Growth Rate, % | 2.00 | |||||||||
| Free cash flow (T + 1) | 126 | |||||||||
| Terminal Value | 4,233 | |||||||||
| Present Terminal Value | 3,320 | |||||||||
| Enterprise Value | 3,738 | |||||||||
| Net Debt | 1,490 | |||||||||
| Equity Value | 2,248 | |||||||||
| Diluted Shares Outstanding, MM | 3,160 | |||||||||
| Equity Value Per Share | 71.15 |
What You Will Receive
- Authentic Assura Data: Preloaded financial figures – from revenue to EBIT – utilizing actual and projected statistics.
- Complete Customization: Modify all essential parameters (yellow cells) such as WACC, growth %, and tax rates.
- Immediate Valuation Adjustments: Automatic recalculations to evaluate the effects of changes on Assura's fair value.
- Flexible Excel Template: Designed for easy modifications, scenario analysis, and comprehensive projections.
- Efficient and Precise: Avoid the hassle of building models from scratch, while ensuring accuracy and adaptability.
Key Features
- Comprehensive Assura Plc Data: Pre-filled with Assura's historical financial performance and future projections.
- Customizable Financial Inputs: Modify revenue growth rates, profit margins, WACC, tax rates, and capital expenditures to fit your analysis.
- Dynamic Valuation Model: Instant updates to Net Present Value (NPV) and intrinsic value based on your customized inputs.
- Scenario Analysis: Develop various forecasting scenarios to evaluate different valuation results.
- User-Friendly Interface: Intuitive, organized, and suitable for both professionals and novices.
How It Works
- Step 1: Download the ready-made Excel template featuring Assura Plc’s data.
- Step 2: Review the pre-filled sheets to grasp the essential metrics.
- Step 3: Modify forecasts and assumptions in the editable yellow cells (WACC, growth, margins).
- Step 4: Instantly see the recalculated results, including Assura Plc’s intrinsic value.
- Step 5: Utilize the outputs to make informed investment decisions or create reports.
Why Choose This Calculator for Assura Plc (AGRL)?
- All-in-One Tool: Features DCF, WACC, and financial ratio assessments all in a single platform.
- Flexible Inputs: Modify the yellow-highlighted fields to experiment with different scenarios.
- In-Depth Analysis: Automatically computes Assura Plc's intrinsic value and Net Present Value.
- Preloaded Information: Comes with historical and projected data for reliable starting metrics.
- High-Quality Standards: Perfect for financial analysts, investors, and business consultants.
Who Can Benefit from Assura Plc (AGRL)?
- Investors: Make informed investment choices with a robust valuation tool tailored for precision.
- Financial Analysts: Enhance efficiency with a ready-to-use DCF model that can be easily customized.
- Consultants: Seamlessly modify the template for impactful client presentations or detailed reports.
- Finance Enthusiasts: Expand your knowledge of valuation methods through practical, real-world examples.
- Educators and Students: Leverage this resource as a hands-on tool in finance education and coursework.
Components of the Template
- Preloaded AGRL Data: Historical and projected financial information, encompassing revenue, EBIT, and capital expenditures.
- DCF and WACC Models: High-quality spreadsheets designed to compute intrinsic value and the Weighted Average Cost of Capital.
- Editable Inputs: Yellow-highlighted fields for modifying revenue growth, tax rates, and discount rates.
- Financial Statements: Detailed annual and quarterly financial reports for in-depth analysis.
- Key Ratios: Profitability, leverage, and efficiency ratios to assess performance metrics.
- Dashboard and Charts: Visual representations of valuation results and underlying assumptions.
Disclaimer
All information, articles, and product details provided on this website are for general informational and educational purposes only. We do not claim any ownership over, nor do we intend to infringe upon, any trademarks, copyrights, logos, brand names, or other intellectual property mentioned or depicted on this site. Such intellectual property remains the property of its respective owners, and any references here are made solely for identification or informational purposes, without implying any affiliation, endorsement, or partnership.
We make no representations or warranties, express or implied, regarding the accuracy, completeness, or suitability of any content or products presented. Nothing on this website should be construed as legal, tax, investment, financial, medical, or other professional advice. In addition, no part of this site—including articles or product references—constitutes a solicitation, recommendation, endorsement, advertisement, or offer to buy or sell any securities, franchises, or other financial instruments, particularly in jurisdictions where such activity would be unlawful.
All content is of a general nature and may not address the specific circumstances of any individual or entity. It is not a substitute for professional advice or services. Any actions you take based on the information provided here are strictly at your own risk. You accept full responsibility for any decisions or outcomes arising from your use of this website and agree to release us from any liability in connection with your use of, or reliance upon, the content or products found herein.