
|
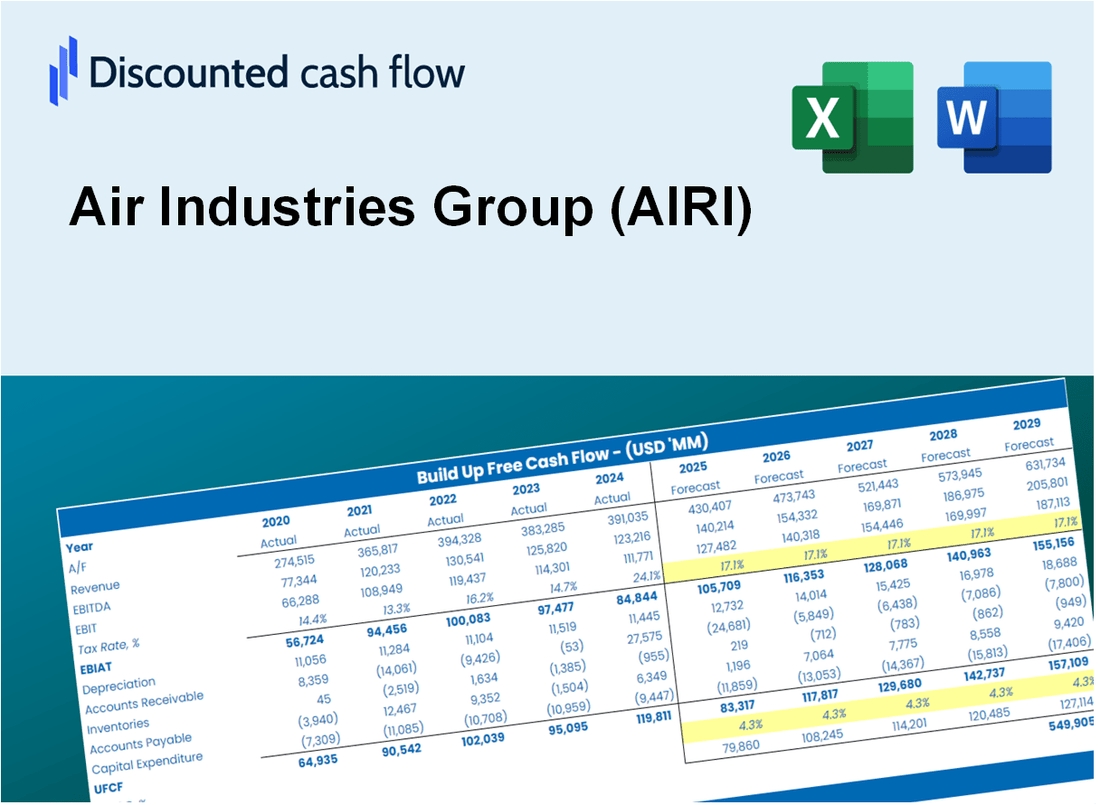
Air Industries Group (AIRI) DCF -Bewertung |
Fully Editable: Tailor To Your Needs In Excel Or Sheets
Professional Design: Trusted, Industry-Standard Templates
Investor-Approved Valuation Models
MAC/PC Compatible, Fully Unlocked
No Expertise Is Needed; Easy To Follow
Air Industries Group (AIRI) Bundle
Unabhängig davon, ob Sie ein Anleger oder Analyst sind, ist dieser (Airi) DCF-Taschenrechner Ihre Anlaufstelle für eine genaue Bewertung. Mit realen Daten der Air Industries Group geladen, können Sie die Prognosen problemlos anpassen und die Auswirkungen in Echtzeit beobachten.
Discounted Cash Flow (DCF) - (USD MM)
| Year | AY1 2020 |
AY2 2021 |
AY3 2022 |
AY4 2023 |
AY5 2024 |
FY1 2025 |
FY2 2026 |
FY3 2027 |
FY4 2028 |
FY5 2029 |
|---|---|---|---|---|---|---|---|---|---|---|
| Revenue | 50.1 | 58.9 | 53.2 | 51.5 | 55.1 | 56.7 | 58.4 | 60.1 | 61.9 | 63.7 |
| Revenue Growth, % | 0 | 17.65 | -9.67 | -3.23 | 6.97 | 2.93 | 2.93 | 2.93 | 2.93 | 2.93 |
| EBITDA | 4.5 | 6.2 | 3.3 | 2.7 | 3.5 | 4.2 | 4.3 | 4.5 | 4.6 | 4.7 |
| EBITDA, % | 8.9 | 10.5 | 6.25 | 5.33 | 6.26 | 7.45 | 7.45 | 7.45 | 7.45 | 7.45 |
| Depreciation | 3.1 | 3.3 | 3.1 | 3.0 | 2.9 | 3.2 | 3.3 | 3.4 | 3.5 | 3.6 |
| Depreciation, % | 6.09 | 5.59 | 5.76 | 5.74 | 5.31 | 5.7 | 5.7 | 5.7 | 5.7 | 5.7 |
| EBIT | 1.4 | 2.9 | .3 | -.2 | .5 | 1.0 | 1.0 | 1.1 | 1.1 | 1.1 |
| EBIT, % | 2.8 | 4.91 | 0.49213 | -0.40958 | 0.9563 | 1.75 | 1.75 | 1.75 | 1.75 | 1.75 |
| Total Cash | 2.5 | .6 | .3 | .3 | .8 | 1.0 | 1.0 | 1.0 | 1.1 | 1.1 |
| Total Cash, percent | .0 | .0 | .0 | .0 | .0 | .0 | .0 | .0 | .0 | .0 |
| Account Receivables | 8.8 | 10.5 | 9.8 | 8.2 | 9.2 | 9.8 | 10.1 | 10.4 | 10.7 | 11.0 |
| Account Receivables, % | 17.56 | 17.77 | 18.37 | 15.89 | 16.69 | 17.26 | 17.26 | 17.26 | 17.26 | 17.26 |
| Inventories | 32.1 | 29.5 | 31.8 | 29.9 | 28.8 | 32.2 | 33.2 | 34.2 | 35.2 | 36.2 |
| Inventories, % | 64.12 | 50.11 | 59.77 | 57.95 | 52.28 | 56.84 | 56.84 | 56.84 | 56.84 | 56.84 |
| Accounts Payable | 7.2 | 5.5 | 6.4 | 5.5 | 5.6 | 6.4 | 6.6 | 6.8 | 7.0 | 7.2 |
| Accounts Payable, % | 14.45 | 9.26 | 12.1 | 10.6 | 10.13 | 11.31 | 11.31 | 11.31 | 11.31 | 11.31 |
| Capital Expenditure | -3.8 | -1.4 | -2.4 | -2.1 | -2.3 | -2.6 | -2.6 | -2.7 | -2.8 | -2.9 |
| Capital Expenditure, % | -7.58 | -2.31 | -4.43 | -4.11 | -4.18 | -4.52 | -4.52 | -4.52 | -4.52 | -4.52 |
| Tax Rate, % | 0 | 0 | 0 | 0 | 0 | 0 | 0 | 0 | 0 | 0 |
| EBITAT | -17.9 | 2.9 | .3 | -.2 | .5 | .8 | .8 | .8 | .9 | .9 |
| Depreciation | ||||||||||
| Changes in Account Receivables | ||||||||||
| Changes in Inventories | ||||||||||
| Changes in Accounts Payable | ||||||||||
| Capital Expenditure | ||||||||||
| UFCF | -52.3 | 4.0 | .4 | 3.2 | 1.3 | -1.7 | .5 | .5 | .5 | .5 |
| WACC, % | 1.21 | 6.25 | 6.25 | 6.25 | 6.25 | 5.24 | 5.24 | 5.24 | 5.24 | 5.24 |
| PV UFCF | ||||||||||
| SUM PV UFCF | .0 | |||||||||
| Long Term Growth Rate, % | 2.00 | |||||||||
| Free cash flow (T + 1) | 1 | |||||||||
| Terminal Value | 16 | |||||||||
| Present Terminal Value | 12 | |||||||||
| Enterprise Value | 12 | |||||||||
| Net Debt | 27 | |||||||||
| Equity Value | -15 | |||||||||
| Diluted Shares Outstanding, MM | 3 | |||||||||
| Equity Value Per Share | -4.47 |
What You Will Get
- Real AIRI Financial Data: Pre-filled with Air Industries Group’s historical and projected data for precise analysis.
- Fully Editable Template: Modify key inputs like revenue growth, WACC, and EBITDA % with ease.
- Automatic Calculations: See Air Industries Group’s intrinsic value update instantly based on your changes.
- Professional Valuation Tool: Designed for investors, analysts, and consultants seeking accurate DCF results.
- User-Friendly Design: Simple structure and clear instructions for all experience levels.
Key Features
- Accurate Financial Data for Air Industries Group: Gain access to reliable pre-loaded historical data and future forecasts specific to (AIRI).
- Tailorable Forecast Inputs: Modify highlighted fields such as WACC, growth rates, and profit margins to suit your analysis.
- Real-Time Calculations: Enjoy automatic updates for DCF, Net Present Value (NPV), and cash flow assessments.
- Interactive Visual Dashboard: Utilize clear charts and summaries to effectively visualize your valuation outcomes.
- Designed for All Levels: An intuitive layout catering to investors, CFOs, and consultants, from novices to experts.
How It Works
- Step 1: Download the Excel file for Air Industries Group (AIRI).
- Step 2: Review the pre-filled financial data and forecasts for Air Industries Group (AIRI).
- Step 3: Modify key inputs such as revenue growth, WACC, and tax rates (highlighted cells) for Air Industries Group (AIRI).
- Step 4: Observe the DCF model update in real-time as you adjust your assumptions for Air Industries Group (AIRI).
- Step 5: Analyze the outputs and leverage the results for your investment strategies regarding Air Industries Group (AIRI).
Why Choose Air Industries Group (AIRI)?
- Industry Expertise: Benefit from years of experience in aerospace and defense manufacturing.
- Quality Assurance: Our commitment to excellence ensures top-tier products and services.
- Innovative Solutions: Leverage cutting-edge technology to meet your specific needs.
- Customer-Centric Approach: We prioritize your satisfaction with tailored support and services.
- Proven Track Record: Trusted by leading companies in the industry for reliable performance.
Who Should Use This Product?
- Investors: Effectively assess Air Industries Group’s (AIRI) fair value prior to making investment choices.
- CFOs: Utilize a high-quality DCF model for accurate financial reporting and analysis of Air Industries Group (AIRI).
- Consultants: Seamlessly modify the template for valuation reports tailored to clients interested in Air Industries Group (AIRI).
- Entrepreneurs: Acquire knowledge of financial modeling practices employed by leading companies, including Air Industries Group (AIRI).
- Educators: Implement it as a teaching resource to illustrate valuation techniques relevant to Air Industries Group (AIRI).
What the Template Contains
- Preloaded AIRI Data: Historical and projected financial data, including revenue, EBIT, and capital expenditures.
- DCF and WACC Models: Professional-grade sheets for calculating intrinsic value and Weighted Average Cost of Capital.
- Editable Inputs: Yellow-highlighted cells for adjusting revenue growth, tax rates, and discount rates.
- Financial Statements: Comprehensive annual and quarterly financials for deeper analysis.
- Key Ratios: Profitability, leverage, and efficiency ratios to evaluate performance.
- Dashboard and Charts: Visual summaries of valuation outcomes and assumptions.
Disclaimer
All information, articles, and product details provided on this website are for general informational and educational purposes only. We do not claim any ownership over, nor do we intend to infringe upon, any trademarks, copyrights, logos, brand names, or other intellectual property mentioned or depicted on this site. Such intellectual property remains the property of its respective owners, and any references here are made solely for identification or informational purposes, without implying any affiliation, endorsement, or partnership.
We make no representations or warranties, express or implied, regarding the accuracy, completeness, or suitability of any content or products presented. Nothing on this website should be construed as legal, tax, investment, financial, medical, or other professional advice. In addition, no part of this site—including articles or product references—constitutes a solicitation, recommendation, endorsement, advertisement, or offer to buy or sell any securities, franchises, or other financial instruments, particularly in jurisdictions where such activity would be unlawful.
All content is of a general nature and may not address the specific circumstances of any individual or entity. It is not a substitute for professional advice or services. Any actions you take based on the information provided here are strictly at your own risk. You accept full responsibility for any decisions or outcomes arising from your use of this website and agree to release us from any liability in connection with your use of, or reliance upon, the content or products found herein.