
|
Alexander's, Inc. (ALX) DCF -Bewertung |
Fully Editable: Tailor To Your Needs In Excel Or Sheets
Professional Design: Trusted, Industry-Standard Templates
Investor-Approved Valuation Models
MAC/PC Compatible, Fully Unlocked
No Expertise Is Needed; Easy To Follow
Alexander's, Inc. (ALX) Bundle
Bewerten Sie Alexander's, Inc. (ALX) Finanzaussichten wie ein Experte! Dieser (ALX) DCF-Taschenrechner verfügt über vorgefüllte Finanzdaten und bietet totale Flexibilität, um das Umsatzwachstum, WACC, Margen und andere wesentliche Annahmen zu ändern, um sich an Ihren Vorhersagen auszurichten.
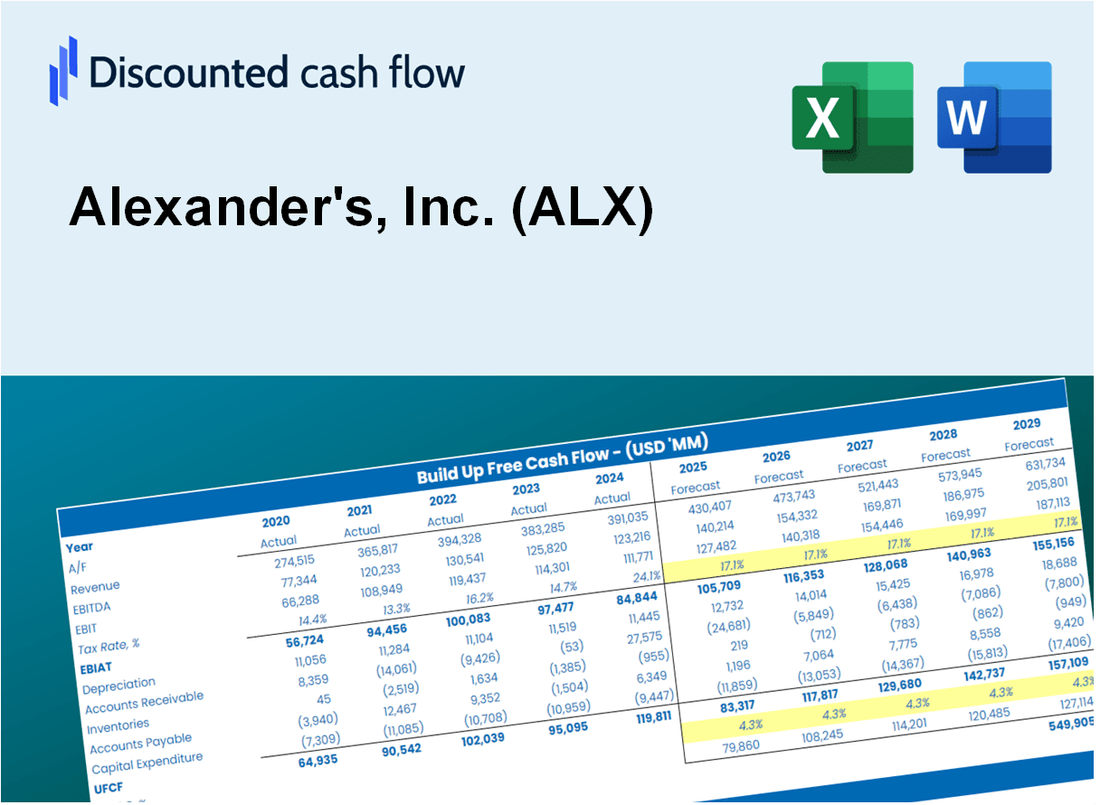
Discounted Cash Flow (DCF) - (USD MM)
| Year | AY1 2020 |
AY2 2021 |
AY3 2022 |
AY4 2023 |
AY5 2024 |
FY1 2025 |
FY2 2026 |
FY3 2027 |
FY4 2028 |
FY5 2029 |
|---|---|---|---|---|---|---|---|---|---|---|
| Revenue | 199.1 | 206.1 | 205.8 | 225.0 | 226.4 | 233.9 | 241.7 | 249.7 | 258.0 | 266.6 |
| Revenue Growth, % | 0 | 3.52 | -0.16202 | 9.3 | 0.62766 | 3.32 | 3.32 | 3.32 | 3.32 | 3.32 |
| EBITDA | 107.2 | 184.9 | 117.7 | 117.4 | 144.2 | 148.1 | 153.0 | 158.1 | 163.3 | 168.8 |
| EBITDA, % | 53.83 | 89.67 | 57.18 | 52.19 | 63.68 | 63.31 | 63.31 | 63.31 | 63.31 | 63.31 |
| Depreciation | 35.1 | 34.6 | 31.5 | 32.9 | 37.9 | 37.9 | 39.2 | 40.5 | 41.8 | 43.2 |
| Depreciation, % | 17.64 | 16.78 | 15.28 | 14.62 | 16.74 | 16.21 | 16.21 | 16.21 | 16.21 | 16.21 |
| EBIT | 72.1 | 150.3 | 86.2 | 84.5 | 106.3 | 110.2 | 113.8 | 117.6 | 121.5 | 125.5 |
| EBIT, % | 36.19 | 72.89 | 41.9 | 37.57 | 46.94 | 47.1 | 47.1 | 47.1 | 47.1 | 47.1 |
| Total Cash | 434.7 | 463.5 | 461.9 | 531.9 | 338.5 | 233.9 | 241.7 | 249.7 | 258.0 | 266.6 |
| Total Cash, percent | .0 | .0 | .0 | .0 | .0 | .0 | .0 | .0 | .0 | .0 |
| Account Receivables | 153.4 | 141.8 | 132.2 | 130.9 | 116.9 | 149.6 | 154.6 | 159.7 | 165.1 | 170.5 |
| Account Receivables, % | 77.03 | 68.81 | 64.23 | 58.21 | 51.62 | 63.98 | 63.98 | 63.98 | 63.98 | 63.98 |
| Inventories | .0 | .0 | .0 | .0 | .0 | .0 | .0 | .0 | .0 | .0 |
| Inventories, % | 0 | 0 | 0 | 0 | 0 | 0 | 0 | 0 | 0 | 0 |
| Accounts Payable | 35.3 | 44.7 | 48.8 | 51.8 | 38.7 | 48.3 | 49.9 | 51.6 | 53.3 | 55.0 |
| Accounts Payable, % | 17.75 | 21.67 | 23.7 | 23 | 17.11 | 20.65 | 20.65 | 20.65 | 20.65 | 20.65 |
| Capital Expenditure | .0 | .0 | .0 | .0 | .0 | .0 | .0 | .0 | .0 | .0 |
| Capital Expenditure, % | 0 | 0 | 0 | 0 | 0 | 0 | 0 | 0 | 0 | 0 |
| Tax Rate, % | 0 | 0 | 0 | 0 | 0 | 0 | 0 | 0 | 0 | 0 |
| EBITAT | 72.1 | 153.0 | 86.2 | 84.5 | 106.3 | 110.2 | 113.8 | 117.6 | 121.5 | 125.5 |
| Depreciation | ||||||||||
| Changes in Account Receivables | ||||||||||
| Changes in Inventories | ||||||||||
| Changes in Accounts Payable | ||||||||||
| Capital Expenditure | ||||||||||
| UFCF | -10.9 | 208.4 | 131.4 | 121.6 | 145.2 | 124.9 | 149.6 | 154.6 | 159.7 | 165.0 |
| WACC, % | 6.58 | 6.58 | 6.58 | 6.58 | 6.58 | 6.58 | 6.58 | 6.58 | 6.58 | 6.58 |
| PV UFCF | ||||||||||
| SUM PV UFCF | 620.3 | |||||||||
| Long Term Growth Rate, % | 2.00 | |||||||||
| Free cash flow (T + 1) | 168 | |||||||||
| Terminal Value | 3,672 | |||||||||
| Present Terminal Value | 2,669 | |||||||||
| Enterprise Value | 3,290 | |||||||||
| Net Debt | 765 | |||||||||
| Equity Value | 2,525 | |||||||||
| Diluted Shares Outstanding, MM | 5 | |||||||||
| Equity Value Per Share | 492.02 |
What You Will Receive
- Comprehensive Financial Model: Alexander's, Inc. (ALX) data provides a solid foundation for accurate DCF valuation.
- Complete Forecast Flexibility: Modify revenue growth, profit margins, WACC, and other critical metrics.
- Real-Time Calculations: Automatic updates allow you to view results instantly as you make adjustments.
- Professional-Grade Template: A polished Excel file crafted for high-quality valuation presentations.
- Adaptable and Reusable: Designed for versatility, enabling repeated application for in-depth forecasts.
Key Features
- Comprehensive Historical Data: Alexander's, Inc. (ALX) financial statements and detailed forecasts already included.
- Customizable Parameters: Adjust WACC, tax rates, revenue growth, and EBITDA margins to fit your analysis.
- Real-Time Valuation: Instantly view Alexander's, Inc. (ALX) intrinsic value as you modify inputs.
- Insightful Visualizations: Interactive dashboard charts present valuation outcomes and essential metrics clearly.
- Designed for Precision: A reliable resource for analysts, investors, and finance professionals.
How It Works
- 1. Access the Template: Download and open the Excel file containing Alexander's, Inc. (ALX) preloaded data.
- 2. Modify Assumptions: Adjust key inputs such as growth rates, WACC, and capital expenditures.
- 3. View Results in Real-Time: The DCF model automatically computes intrinsic value and NPV.
- 4. Explore Scenarios: Analyze various forecasts to evaluate different valuation scenarios.
- 5. Present with Assurance: Deliver professional valuation insights to bolster your decision-making.
Why Choose This Calculator for Alexander's, Inc. (ALX)?
- Accurate Data: Utilize real financials from Alexander's, Inc. for dependable valuation outcomes.
- Customizable: Tailor essential parameters such as growth rates, WACC, and tax rates to fit your forecasts.
- Time-Saving: Pre-configured calculations save you the hassle of starting from the ground up.
- Professional-Grade Tool: Crafted for investors, analysts, and consultants focused on Alexander's, Inc. (ALX).
- User-Friendly: Easy-to-navigate design and clear instructions ensure accessibility for all users.
Who Should Use Alexander's, Inc. (ALX)?
- Investors: Assess Alexander's valuation to make informed buying or selling decisions.
- CFOs and Financial Analysts: Optimize valuation workflows and evaluate financial projections.
- Startup Founders: Understand the valuation methods applied to established companies like Alexander's.
- Consultants: Provide expert valuation reports for your clients based on Alexander's performance.
- Students and Educators: Utilize real-time data from Alexander's to learn and teach valuation strategies.
What the Template Contains
- Historical Data: Includes Alexander's, Inc. (ALX) past financials and baseline forecasts.
- DCF and Levered DCF Models: Detailed templates to calculate Alexander's, Inc. (ALX) intrinsic value.
- WACC Sheet: Pre-built calculations for Weighted Average Cost of Capital.
- Editable Inputs: Modify key drivers like growth rates, EBITDA %, and CAPEX assumptions.
- Quarterly and Annual Statements: A complete breakdown of Alexander's, Inc. (ALX) financials.
- Interactive Dashboard: Visualize valuation results and projections dynamically.
Disclaimer
All information, articles, and product details provided on this website are for general informational and educational purposes only. We do not claim any ownership over, nor do we intend to infringe upon, any trademarks, copyrights, logos, brand names, or other intellectual property mentioned or depicted on this site. Such intellectual property remains the property of its respective owners, and any references here are made solely for identification or informational purposes, without implying any affiliation, endorsement, or partnership.
We make no representations or warranties, express or implied, regarding the accuracy, completeness, or suitability of any content or products presented. Nothing on this website should be construed as legal, tax, investment, financial, medical, or other professional advice. In addition, no part of this site—including articles or product references—constitutes a solicitation, recommendation, endorsement, advertisement, or offer to buy or sell any securities, franchises, or other financial instruments, particularly in jurisdictions where such activity would be unlawful.
All content is of a general nature and may not address the specific circumstances of any individual or entity. It is not a substitute for professional advice or services. Any actions you take based on the information provided here are strictly at your own risk. You accept full responsibility for any decisions or outcomes arising from your use of this website and agree to release us from any liability in connection with your use of, or reliance upon, the content or products found herein.