
|
Ambarella, Inc. (AMBA) DCF -Bewertung |
Fully Editable: Tailor To Your Needs In Excel Or Sheets
Professional Design: Trusted, Industry-Standard Templates
Investor-Approved Valuation Models
MAC/PC Compatible, Fully Unlocked
No Expertise Is Needed; Easy To Follow
Ambarella, Inc. (AMBA) Bundle
Möchten Sie Ambarella, Inc.s innerer Wert beurteilen? Unser AMBA DCF-Taschenrechner integriert reale Daten mit umfangreichen Anpassungsoptionen, sodass Sie Prognosen anpassen und Ihre Anlagestrategien verbessern können.
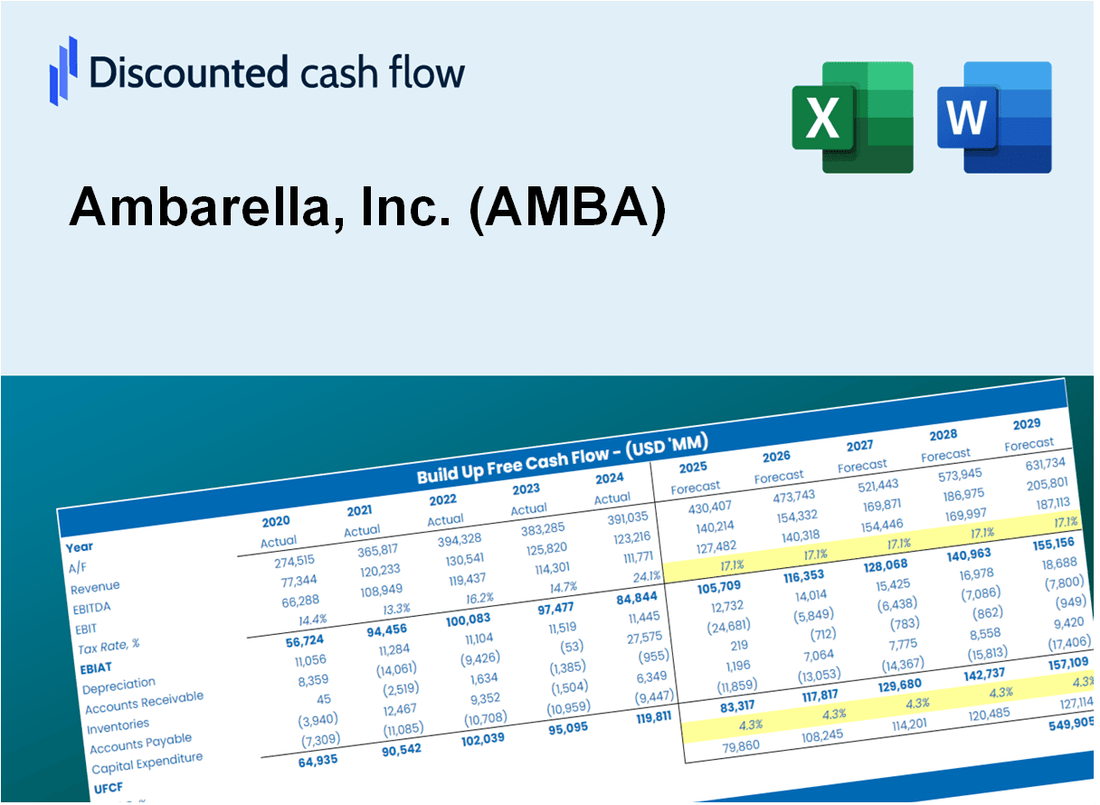
Discounted Cash Flow (DCF) - (USD MM)
| Year | AY1 2021 |
AY2 2022 |
AY3 2023 |
AY4 2024 |
AY5 2025 |
FY1 2026 |
FY2 2027 |
FY3 2028 |
FY4 2029 |
FY5 2030 |
|---|---|---|---|---|---|---|---|---|---|---|
| Revenue | 223.0 | 331.9 | 337.6 | 226.5 | 284.9 | 315.8 | 350.1 | 388.1 | 430.2 | 476.9 |
| Revenue Growth, % | 0 | 48.82 | 1.73 | -32.92 | 25.78 | 10.85 | 10.85 | 10.85 | 10.85 | 10.85 |
| EBITDA | -49.2 | -15.6 | -54.3 | -129.7 | -100.5 | -85.5 | -94.8 | -105.1 | -116.5 | -129.2 |
| EBITDA, % | -22.06 | -4.71 | -16.09 | -57.29 | -35.29 | -27.09 | -27.09 | -27.09 | -27.09 | -27.09 |
| Depreciation | 12.0 | 14.0 | 19.9 | 24.8 | 26.1 | 22.5 | 24.9 | 27.6 | 30.6 | 34.0 |
| Depreciation, % | 5.37 | 4.22 | 5.9 | 10.96 | 9.15 | 7.12 | 7.12 | 7.12 | 7.12 | 7.12 |
| EBIT | -61.2 | -29.6 | -74.3 | -154.6 | -126.6 | -108.0 | -119.8 | -132.8 | -147.2 | -163.1 |
| EBIT, % | -27.43 | -8.93 | -21.99 | -68.25 | -44.44 | -34.21 | -34.21 | -34.21 | -34.21 | -34.21 |
| Total Cash | 440.7 | 171.0 | 206.9 | 219.9 | 250.3 | 251.2 | 278.5 | 308.7 | 342.2 | 379.4 |
| Total Cash, percent | .0 | .0 | .0 | .0 | .0 | .0 | .0 | .0 | .0 | .0 |
| Account Receivables | 25.0 | 44.3 | 52.0 | 25.0 | 29.8 | 38.8 | 43.0 | 47.7 | 52.8 | 58.6 |
| Account Receivables, % | 11.2 | 13.35 | 15.4 | 11.02 | 10.45 | 12.28 | 12.28 | 12.28 | 12.28 | 12.28 |
| Inventories | 26.1 | 45.2 | 40.5 | 29.0 | 34.4 | 39.3 | 43.6 | 48.3 | 53.5 | 59.3 |
| Inventories, % | 11.7 | 13.63 | 11.99 | 12.82 | 12.09 | 12.44 | 12.44 | 12.44 | 12.44 | 12.44 |
| Accounts Payable | 21.1 | 31.2 | 17.8 | 28.5 | 21.8 | 28.0 | 31.1 | 34.4 | 38.2 | 42.3 |
| Accounts Payable, % | 9.47 | 9.39 | 5.29 | 12.59 | 7.64 | 8.88 | 8.88 | 8.88 | 8.88 | 8.88 |
| Capital Expenditure | -4.9 | -9.7 | -15.1 | -12.0 | -10.4 | -11.7 | -13.0 | -14.4 | -15.9 | -17.7 |
| Capital Expenditure, % | -2.22 | -2.92 | -4.46 | -5.29 | -3.64 | -3.7 | -3.7 | -3.7 | -3.7 | -3.7 |
| Tax Rate, % | 0.51135 | 0.51135 | 0.51135 | 0.51135 | 0.51135 | 0.51135 | 0.51135 | 0.51135 | 0.51135 | 0.51135 |
| EBITAT | -63.8 | -27.3 | -68.4 | -176.3 | -125.9 | -104.5 | -115.9 | -128.5 | -142.4 | -157.9 |
| Depreciation | ||||||||||
| Changes in Account Receivables | ||||||||||
| Changes in Inventories | ||||||||||
| Changes in Accounts Payable | ||||||||||
| Capital Expenditure | ||||||||||
| UFCF | -86.7 | -51.4 | -79.8 | -114.3 | -127.2 | -101.4 | -109.4 | -121.2 | -134.4 | -149.0 |
| WACC, % | 13 | 13 | 13 | 13 | 13 | 13 | 13 | 13 | 13 | 13 |
| PV UFCF | ||||||||||
| SUM PV UFCF | -422.8 | |||||||||
| Long Term Growth Rate, % | 2.00 | |||||||||
| Free cash flow (T + 1) | -152 | |||||||||
| Terminal Value | -1,382 | |||||||||
| Present Terminal Value | -750 | |||||||||
| Enterprise Value | -1,173 | |||||||||
| Net Debt | -139 | |||||||||
| Equity Value | -1,034 | |||||||||
| Diluted Shares Outstanding, MM | 41 | |||||||||
| Equity Value Per Share | -25.02 |
What You Will Get
- Pre-Filled Financial Model: Ambarella’s actual data allows for accurate DCF valuation.
- Full Forecast Control: Modify revenue growth, profit margins, WACC, and other essential drivers.
- Instant Calculations: Real-time updates ensure you see results immediately as you adjust inputs.
- Investor-Ready Template: A polished Excel file crafted for high-quality valuation presentations.
- Customizable and Reusable: Designed for adaptability, enabling repeated use for comprehensive forecasts.
Key Features
- Customizable Forecast Inputs: Adjust essential parameters such as revenue growth, EBITDA %, and capital expenditures.
- Instant DCF Valuation: Quickly computes intrinsic value, NPV, and additional financial metrics.
- High Precision Accuracy: Leverages Ambarella's (AMBA) actual financial data for credible valuation results.
- Effortless Scenario Analysis: Easily explore various assumptions and analyze different outcomes.
- Efficiency Booster: Avoid the complexities of constructing detailed valuation models from the ground up.
How It Works
- Step 1: Download the prebuilt Excel template featuring Ambarella, Inc.'s (AMBA) data.
- Step 2: Review the pre-filled sheets to familiarize yourself with the essential metrics.
- Step 3: Modify forecasts and assumptions in the editable yellow cells (WACC, growth, margins).
- Step 4: Instantly see the recalculated results, including Ambarella, Inc.'s (AMBA) intrinsic value.
- Step 5: Make informed investment decisions or create reports based on the generated outputs.
Why Choose This Calculator for Ambarella, Inc. (AMBA)?
- User-Friendly Interface: Tailored for both novices and seasoned professionals.
- Customizable Inputs: Effortlessly adjust parameters to suit your financial analysis.
- Real-Time Feedback: Observe immediate changes in Ambarella’s valuation as you modify inputs.
- Preloaded Data: Comes with Ambarella’s actual financial metrics for swift evaluations.
- Preferred by Experts: Utilized by investors and analysts for making well-informed choices.
Who Should Use This Product?
- Professional Investors: Create comprehensive and precise valuation models for analyzing portfolios involving Ambarella, Inc. (AMBA).
- Corporate Finance Teams: Evaluate valuation scenarios to inform strategic decisions within the organization.
- Consultants and Advisors: Deliver clients accurate valuation insights specifically for Ambarella, Inc. (AMBA) stock.
- Students and Educators: Utilize real-world data to enhance learning and practice in financial modeling related to the tech sector.
- Tech Enthusiasts: Gain insights into how technology firms like Ambarella, Inc. (AMBA) are assessed in the market.
What the Template Contains
- Historical Data: Includes Ambarella’s past financials and baseline forecasts.
- DCF and Levered DCF Models: Detailed templates to calculate Ambarella’s intrinsic value.
- WACC Sheet: Pre-built calculations for Weighted Average Cost of Capital.
- Editable Inputs: Modify key drivers like growth rates, EBITDA %, and CAPEX assumptions.
- Quarterly and Annual Statements: A complete breakdown of Ambarella’s financials.
- Interactive Dashboard: Visualize valuation results and projections dynamically.
Disclaimer
All information, articles, and product details provided on this website are for general informational and educational purposes only. We do not claim any ownership over, nor do we intend to infringe upon, any trademarks, copyrights, logos, brand names, or other intellectual property mentioned or depicted on this site. Such intellectual property remains the property of its respective owners, and any references here are made solely for identification or informational purposes, without implying any affiliation, endorsement, or partnership.
We make no representations or warranties, express or implied, regarding the accuracy, completeness, or suitability of any content or products presented. Nothing on this website should be construed as legal, tax, investment, financial, medical, or other professional advice. In addition, no part of this site—including articles or product references—constitutes a solicitation, recommendation, endorsement, advertisement, or offer to buy or sell any securities, franchises, or other financial instruments, particularly in jurisdictions where such activity would be unlawful.
All content is of a general nature and may not address the specific circumstances of any individual or entity. It is not a substitute for professional advice or services. Any actions you take based on the information provided here are strictly at your own risk. You accept full responsibility for any decisions or outcomes arising from your use of this website and agree to release us from any liability in connection with your use of, or reliance upon, the content or products found herein.