
|
Amneal Pharmaceuticals, Inc. (AMRX) DCF -Bewertung |
Fully Editable: Tailor To Your Needs In Excel Or Sheets
Professional Design: Trusted, Industry-Standard Templates
Investor-Approved Valuation Models
MAC/PC Compatible, Fully Unlocked
No Expertise Is Needed; Easy To Follow
Amneal Pharmaceuticals, Inc. (AMRX) Bundle
Unabhängig davon, ob Sie Investor oder Analyst sind, ist dieser (AMRX) DCF-Taschenrechner Ihre Anlaufstelle für eine genaue Bewertung. Es wird mit echten Daten von Amneal Pharmaceuticals, Inc. vorgeladen, sodass Sie die Prognosen anpassen und die Auswirkungen sofort beobachten können.
What You Will Get
- Editable Excel Template: A fully customizable Excel-based DCF Calculator featuring pre-filled real AMRX financials.
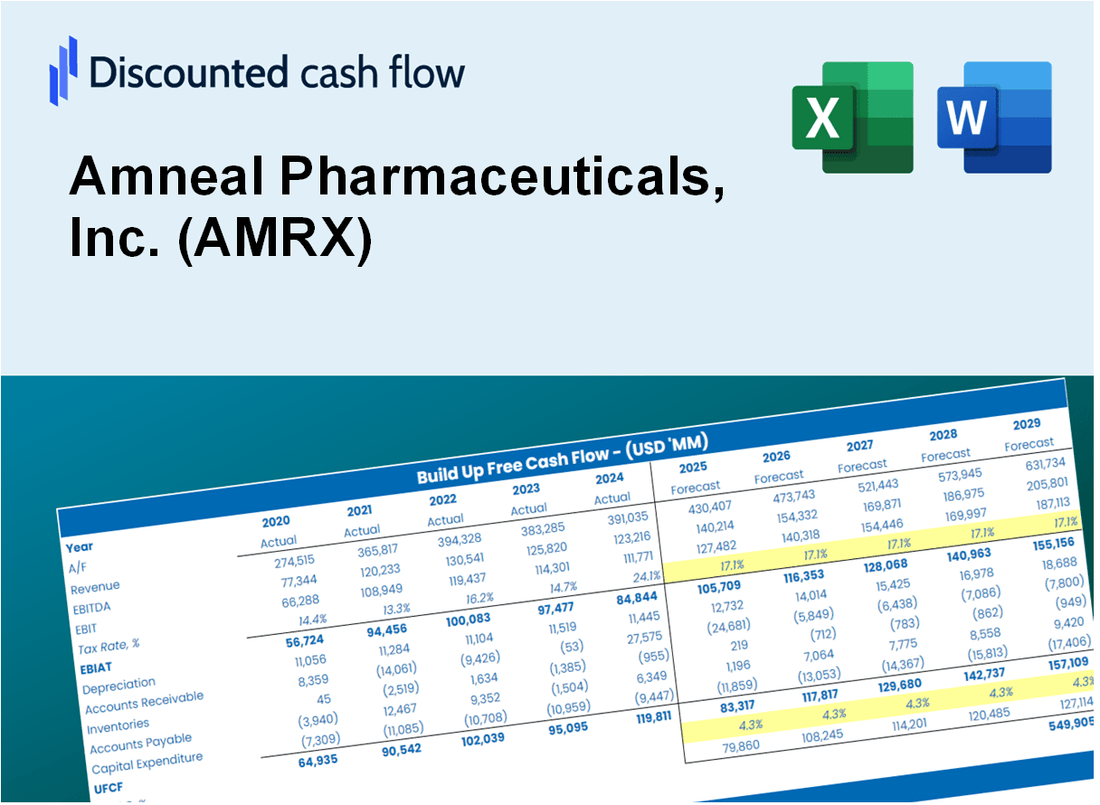
- Real-World Data: Historical data and forward-looking estimates (as highlighted in the yellow cells).
- Forecast Flexibility: Adjust forecast assumptions such as revenue growth, EBITDA %, and WACC.
- Automatic Calculations: Instantly observe the effect of your inputs on Amneal Pharmaceuticals’ valuation.
- Professional Tool: Designed for investors, CFOs, consultants, and financial analysts.
- User-Friendly Design: Organized for clarity and ease of use, complete with step-by-step instructions.
Key Features
- Customizable Financial Inputs: Adjust essential parameters such as revenue growth, EBITDA %, and capital expenditures tailored for Amneal Pharmaceuticals, Inc. (AMRX).
- Instant DCF Valuation: Quickly computes intrinsic value, NPV, and other financial metrics for informed decision-making.
- High-Precision Accuracy: Utilizes Amneal's actual financial data to deliver realistic valuation results.
- Simplified Scenario Analysis: Effortlessly evaluate various assumptions and analyze different outcomes.
- Efficiency Booster: Streamline your valuation process without the hassle of creating complex models from the ground up.
How It Works
- Step 1: Download the Excel file.
- Step 2: Review Amneal Pharmaceuticals’ pre-filled financial data and forecasts.
- Step 3: Modify key inputs such as revenue growth, WACC, and tax rates (highlighted cells).
- Step 4: Observe the DCF model update in real-time as you adjust assumptions.
- Step 5: Evaluate the outputs and leverage the results for investment decisions.
Why Choose This Calculator for Amneal Pharmaceuticals, Inc. (AMRX)?
- Accurate Data: Utilize real Amneal financials for trustworthy valuation outcomes.
- Customizable: Tailor essential parameters like growth rates, WACC, and tax rates to align with your forecasts.
- Time-Saving: Pre-configured calculations save you the hassle of starting from the ground up.
- Professional-Grade Tool: Crafted for investors, analysts, and consultants in the pharmaceutical sector.
- User-Friendly: An intuitive design and clear instructions make it accessible for all users.
Who Should Use This Product?
- Individual Investors: Make informed decisions about buying or selling Amneal Pharmaceuticals stock (AMRX).
- Financial Analysts: Streamline valuation processes with ready-to-use financial models for Amneal Pharmaceuticals (AMRX).
- Consultants: Deliver professional valuation insights related to Amneal Pharmaceuticals (AMRX) to clients quickly and accurately.
- Business Owners: Understand how pharmaceutical companies like Amneal Pharmaceuticals (AMRX) are valued to guide your own strategy.
- Finance Students: Learn valuation techniques using real-world data and scenarios involving Amneal Pharmaceuticals (AMRX).
What the Template Contains
- Historical Data: Includes Amneal Pharmaceuticals’ past financials and baseline forecasts.
- DCF and Levered DCF Models: Detailed templates to calculate Amneal Pharmaceuticals’ intrinsic value.
- WACC Sheet: Pre-built calculations for Weighted Average Cost of Capital.
- Editable Inputs: Modify key drivers like growth rates, EBITDA %, and CAPEX assumptions.
- Quarterly and Annual Statements: A complete breakdown of Amneal Pharmaceuticals’ financials.
- Interactive Dashboard: Visualize valuation results and projections dynamically.
Disclaimer
All information, articles, and product details provided on this website are for general informational and educational purposes only. We do not claim any ownership over, nor do we intend to infringe upon, any trademarks, copyrights, logos, brand names, or other intellectual property mentioned or depicted on this site. Such intellectual property remains the property of its respective owners, and any references here are made solely for identification or informational purposes, without implying any affiliation, endorsement, or partnership.
We make no representations or warranties, express or implied, regarding the accuracy, completeness, or suitability of any content or products presented. Nothing on this website should be construed as legal, tax, investment, financial, medical, or other professional advice. In addition, no part of this site—including articles or product references—constitutes a solicitation, recommendation, endorsement, advertisement, or offer to buy or sell any securities, franchises, or other financial instruments, particularly in jurisdictions where such activity would be unlawful.
All content is of a general nature and may not address the specific circumstances of any individual or entity. It is not a substitute for professional advice or services. Any actions you take based on the information provided here are strictly at your own risk. You accept full responsibility for any decisions or outcomes arising from your use of this website and agree to release us from any liability in connection with your use of, or reliance upon, the content or products found herein.